How to make a matplotlib histogram

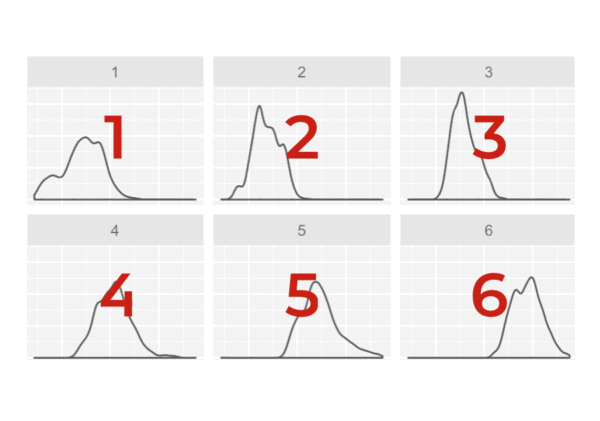
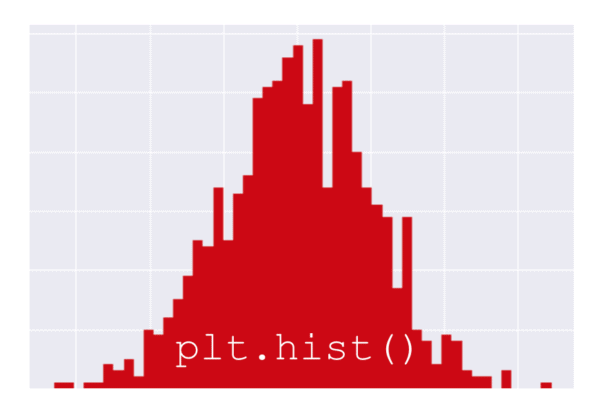
This tutorial will explain how to make a matplotlib histogram. If you’re interested in data science and data visualization in Python, then read on. This post will explain how to make a histogram in Python using matplotlib. Here’s exactly what the tutorial will cover: A quick introduction to matplotlib The syntax for the matplotlib histogram … Read more
How to use the NumPy mean function

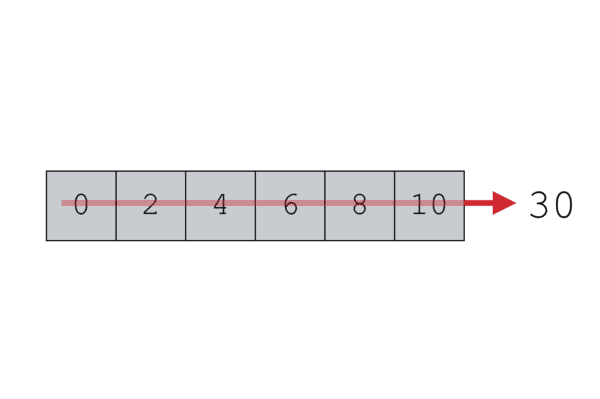
A visual representation of how NumPy mean computes the average of a NumPy array.

This tutorial will show you how to use the NumPy mean function, which you’ll often see in code as numpy.mean or np.mean. It will teach you how the NumPy mean function works at a high level and it will also show you some of the details. So, you’ll learn about the syntax of np.mean, including … Read more

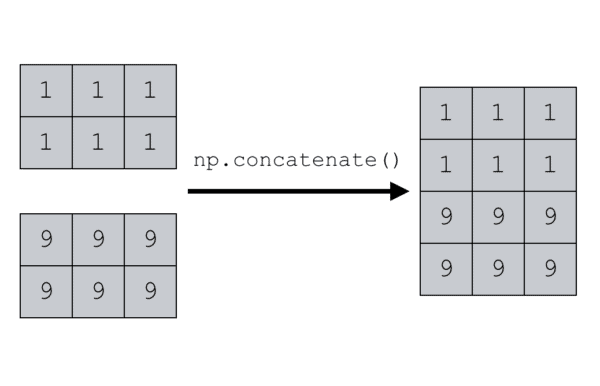
How to use the NumPy concatenate function

This tutorial will explain how to use the NumPy concatenate function in Python (which is sometimes called np.concatenate). This post will cover several topics. If you don’t want to read the full tutorial, click on the appropriate link and it will send you to the relevant section of this tutorial. This post will cover: What … Read more

How to use the Numpy ones function

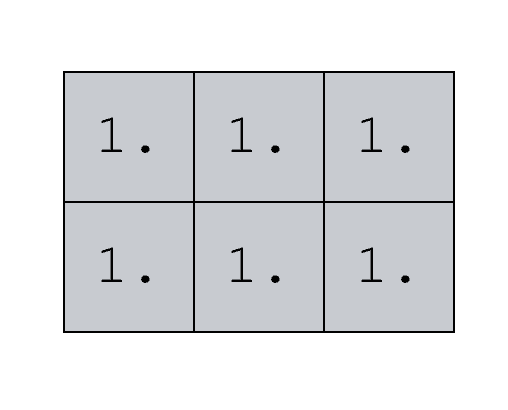
A visual representation of a 2x3 numpy array created with the NumPy ones function.

In this tutorial I’ll show you how to use the NumPy ones function, which is often called np.ones. What the numpy ones function does The NumPy ones function creates NumPy arrays filled with 1‘s. That’s it. It’s pretty straight forward. The np.ones function is also fairly easy to use. But, there are a few details … Read more

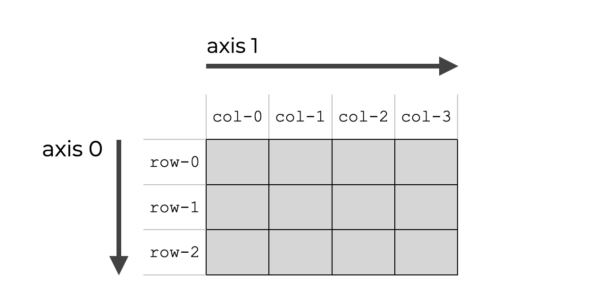
Numpy Axes, Explained

This tutorial will explain NumPy axes. It will explain what a NumPy axis is. The tutorial will also explain how axes work, and how we use them with NumPy functions. Although it’s probably best for you to read the full tutorial, if you want to skip ahead, you can do so by clicking on one … Read more

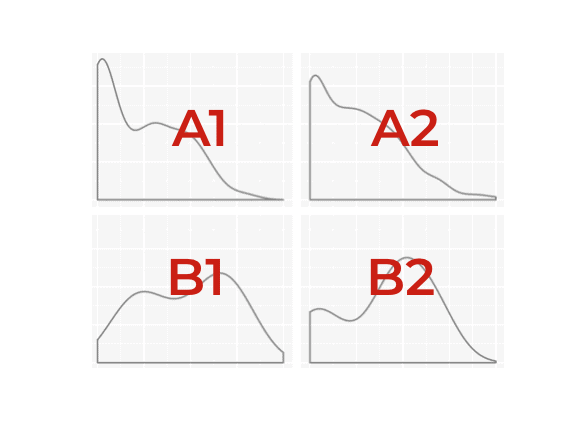
How to use facet_grid in ggplot2

This tutorial will show you how to use facet_grid in ggplot2. Specifically, it will show you how to use facet_grid to create small multiple charts. facet_grid is fairly easy to understand, but it assumes some basic knowledge of ggplot2. ggplot2 is a data visualization package for the R programming language. If you don’t already know … Read more

A ggplot2 tutorial for beginners

This blog post is a fairly comprehensive ggplot2 tutorial for beginners. If you’re new to R and ggplot, this ggplot2 tutorial will cover a few things: What ggplot2 is The syntax of ggplot2 Examples of how to use ggplot2 If you’re new to ggplot, I recommend that you read the whole tutorial. But if you … Read more

How to use to facet_wrap in ggplot2

This tutorial will teach you how to use facet_wrap to create small multiple charts in ggplot2. The small multiple design is an incredibly powerful (and underused) data visualization technique. facet_wrap is great, because it enables you to create small multiple charts easily and effectively. It makes it easy to create small multiple charts. Having said … Read more

How to use geom_line in ggplot2

This tutorial will show you how to use geom_line to create line charts with ggplot2. Using geom_line is fairly straight forward if you know ggplot2. But if you’re a relative beginner to ggplot, it can be a little intimidating. That being said, I’m going to walk you through the syntax step by step. We’ll first … Read more

How to Use the Numpy Sum Function

This tutorial will show you how to use the NumPy sum function (sometimes called np.sum). In the tutorial, I’ll explain what the function does. I’ll also explain the syntax of the function step by step. Finally, I’ll show you some concrete examples so you can see exactly how np.sum works. Let’s jump in. NumPy sum … Read more