Readers at the Sharp Sight blog will know that I put a lot of emphasis on data manipulation.
You’ve heard me repeat the stat many times: 80% of your work as a data scientist will be data manipulation.
Although there is a little nuance to that statement, roughly speaking, it’s true. A lot of your work will involve getting, cleaning, reshaping, and aggregating your data.
But data manipulation is not only one of the most common tasks you’ll need to perform.
It’s also one of the most challenging tasks for most people trying to learn data science.
Have you ever gotten stuck when trying to wrangle or clean a dataset?
You’re not alone.
Data manipulation is hard.
A secret about data manipulation
Having said that, there’s a secret that you should know about data manipulation.
Even though many people get stuck, it’s much easier than you think, once you simplify it down to the core operations that you need to perform.
There are 19 “building blocks” for data manipulation in Python
To do most data manipulation, you only need to be able to perform a few operations with a handful of techniques.
In particular, in Python, there are 19 “core” techniques that make up the vast majority of the work.
These 19 techniques are like building blocks …
They are like little components that you can just snap together to do data manipulation tasks.
When you look at it this way, data manipulation becomes much more simple.
For the most part, to master data manipulation, you only need to do two things:
- Learn the 19 data manipulation techniques
- Learn how to put the techniques together
When you think about it that way, it’s pretty easy!
Once you know the simple building blocks, you can put them together to perform fairly complex data manipulation in Python.
The 19 Pandas Methods You Need to Master
So what are these techniques?
To master data manipulation in Python using Pandas, you need to learn these techniques:
- read csv
- set index
- reset index
- loc
- iloc
- drop
- dropna
- fillna
- assign
- filter
- query
- rename
- sort values
- agg
- groupby
- concat
- merge
- pivot
- melt
All things considered, it’s a pretty brief list.
You don’t need to learn 1000 things. Only 19.
If you studied hard, you could do it in only a couple of weeks.
Let’s quickly review what each of these do.
read csv
When you start wrangling and cleaning your data, one of the first things that you typically need to do is just get your data.
Often, your data will be in an external data source, and one of the most common sources is .csv files (“comma separated” text files).
That being said, you should know the Pandas read_csv() function and how to use it.
The read_csv() function takes a .csv file and reads the data into a Python dataframe.
Keep in mind that once you do this, the data in the dataframe will still be messy. You’ll still need to do a lot of data cleaning to make the data ready for analysis or visualization.
(That’s what most of the other techniques are for.)
set index
After you get your data, you’ll often need to set an “index” for the rows of the dataframe.
An index (particularly, a row index) is a number or string that identifies the row.
By default, the index values of a dataframe are integers. These allow you to get the data for row “1” or row “10” (as we’ll see later.
But you can use Pandas set_index to replace the default index values, and use things that are more meaningful. For example, if you were working data about world countries, you might want to use the 3-letter country codes as the row index, assuming you had those codes in your data.
Again: indexes make it easier to retrieve and subset your data. They are also used for “join” operations, when you need to join together multiple datasets.
That being the case, you need to know what indexes are, and you need to be able to use the Pandas set_index() method.
reset index
Sometimes, when you’re wrangling your data, you need to change the index of the dataframe, or remove it altogether.
This is particularly true once you start doing more advanced computations … sometimes, you need to change the index or temporarily remove it to create a particular data visualization.
The Pandas reset_index() enables you to do just that. It allows you to remove or change the dataframe index.
loc
Once you have your indexes set properly, you can use the index to create subsets.
This is one of the most common tasks you’ll need to perform.
It’s common to subset your data in the beginning stages of data cleaning (to inspect the data), but it’s also extremely common to create subsets at later stages as well … both later in the data manipulation phase, and also in more advanced data science phases like data visualization and analysis.
The .loc[] method enables you to subset data by character index.
iloc
The .iloc[] method is similar to .loc[] in that it enables you to subset by an index, but when you use .iloc[], you subset by the integer index of the dataframe. (Dataframes have integers index values for every row and column.)
Again, subsetting is really important for data inspection, but also for data visualization and analysis. You need to know this.
drop
In data manipulation and cleaning, there are times when you need to delete rows of data.
Sometimes, you want to delete rows permanently, because they don’t belong in your data for one reason or another.
Other times, you just want to remove rows temporarily so they don’t appear in a data visualization or data aggregation.
In Pandas, you can delete rows of data using the drop() method.
dropna
Alternatively, you might only want to drop missing data.
So for example, if all of the data are missing for a row, it’s fairly likely that you’ll want to remove that row of data.
In other cases, you might not care if the data are missing for certain variables, but if the data are missing for an “important” variable, you will need to delete the row.
For example, if you have data for customers at a bank, it might be okay if the data for the customer’s age is missing, but it might be really bad if their name is missing. So you want to be able to selectively delete a row if the data are missing for a person’s name.
In Pandas, you can do this with dropna(). The dropna() method enables you to delete rows with missing data … either if all of the data are missing, or if the data are missing for particular variables.
fillna
Dealing with missing values is an important part of data cleaning.
As mentioned above, you can delete rows with missing data.
But frequently, you will want to fill in the missing data.
With Pandas, you can fill in those missing values with fillna().
The fillna() method lets you “fill in” the missing values with a value of your choice.
rename
Once you fix problems in the rows of data, you commonly want to fix issues with the columns in your data.
One of the most common problems is that the names of the variables are incorrect or the names simply need to be changed.
You can use the Pandas rename() method to rename variables in a Pandas dataframe.
assign
It’s also common to create new variables.
For example, let’s say that you have data about houses that were sold. The data has one variable called price, which is the sale price of the house. And the data has another variable called square_feet, which specifies the square feet of the home.
What if you want to do an analysis that involves price per square foot?
You’ll probably need to create new variable that contains price per square foot.
In Python, you can do this with the Pandas assign() method.
The assign() method is simple. It enables you to create new variables in a Pandas dataframe.
pivot
Sometimes, after you clean up the rows and columns, you need to “reshape” your data.
We call this process of “reshaping” your data transposition.
One of the tools for doing this in Pandas is the pivot() function.
The pivot method transposes your data from long form to wide form.
melt
The other major tool for reshaping your data is the melt() function.
Whereas pivot transposes from long to wide …
The melt method transposes from wide to long.
If those concepts are a little confusing, that’s okay. Reshaping data with melt() and pivot() often confuse people.
A lot of people get completely stuck at this stage.
The truth though, is that transposing data isn’t that hard. You just need someone to show you clear examples that build your intuition, and you need to master these two functions, melt() and pivot().
Once you know how they work, and once you’ve memorized the syntax, transposing your data is fairly straightforward.
concat
Once you’ve cleaned rows and columns and transposed your data into the right shape, you sometimes need to combine data.
This is the case if you have multiple datasets.
One of the ways to combine data is with concat().
The concat() function stacks multiple dataframes.
So if you have multiple datasets with different rows that you need to combine together, you can use concat() to “stack” them into one dataframe.
merge
If you have multiple dataframes, you might also need to “merge” your data.
A merge operation is when you need to join two datasets together on an index or on the values for some row.
So let’s say that you have two different datasets. Each dataset has rows of data for particular people, and you want to “join” or combine the data based on the peoples’ names.
You can do this with the Pandas merge() method, although it’s also possible to do it with the join() method as well.
filter
So once you have your data cleaned up, reshaped, and joined together, what do you do?
Often, you need to analyze your data.
This frequently requires you to create new subsets of data, which you can then then sort, group, and aggregate.
You need to be able to filter down to specific columns.
The filter() method enable you to do this. It enables you to retrieve specific columns of a dataframe.
(To be clear, you also use the filter() method during data cleaning.)
query
During analysis, it’s also extremely common to subset the rows.
Earlier, I mentioned loc[] and iloc[], which enable you to subset rows based on index values.
But you can also subset rows based on logical conditions.
For example, if you were analyzing data with bank customers, you might want to retrieve data only for customers who are 18 or older. The logical condition, age >= 18, acts as a condition for the subset … keep a row if True and exclude the row if False.
You can perform operations like this in Python with the query() method.
Keep in mind that there are other ways to do this in Python besides the query() method. Many people use a complicated “bracket” notation to retrieve data from Pandas dataframes based on logical conditions.
To be honest, the other ways to do this are a lot more complicated and harder to read.
If you aren’t already using it, you should be using the query() method to subset your data based on logical conditions. The code is much easier to read and write than the alternatives.
sort values
Sometimes, when cleaning, inspecting, or analyzing your data, you need to sort the rows based on some variable.
So for example, if you have a dataset with different people, maybe you want to sort the rows of data by age.
In Pandas, you can do this with the sort_values() method.
This is fairly common in data inspection.
But it’s also very common in data visualization and data analysis.
If you’ve ever needed to display your data in a specific, sorted order, this is the tool that you need.
groupby
In data analysis, it is extremely common to aggregate your data by a group.
That is, you commonly need to compute some metric by category. For example, lets say that you have bank data for individual bank customers. If you want to compute the average checking account balance by city, you’ll need to group your data by a city variable.
To do this in Pandas, you need to use the groupby() method.
I need to emphasize how common this is. This is a critical data manipulation tool that you will use over and over again, both in data cleaning, but also particularly in data analysis.
If you feel like you can’t analyze your data well, you probably need to learn how to use this method better.
agg
Finally, there’s agg().
In Pandas, we use agg() to compute summary statistics.
So if you have a large dataset, and you need to compute the average, maximum, minimum, or sum of some variable, agg() is the tool you need.
This is a critical tool for data analysis. To analyze your data, you should be using this frequently.
Moreover, it becomes even more powerful once you combine it with groupby().
Data wrangling is much easier than you think
That’s about it.
19 tools.
The 19 tools that I just listed account for the vast majority of all data cleaning and data manipulation.
That also includes most of the data manipulation that you need for data visualization and analysis.
Think about it.
You only need to master 19 techniques to do the vast majority of data manipulation.
If you learned one technique per day, you could learn them all in less than a month.
Pandas Method Chains “Puts the Pieces Together”
Once you master these 19 Pandas techniques, you need to learn how to put them together in Pandas Method Chains.
You can string together multiple Pandas methods into a chain. And if you put the whole expression inside of parenthesis, you can perform very complex data manipulations.
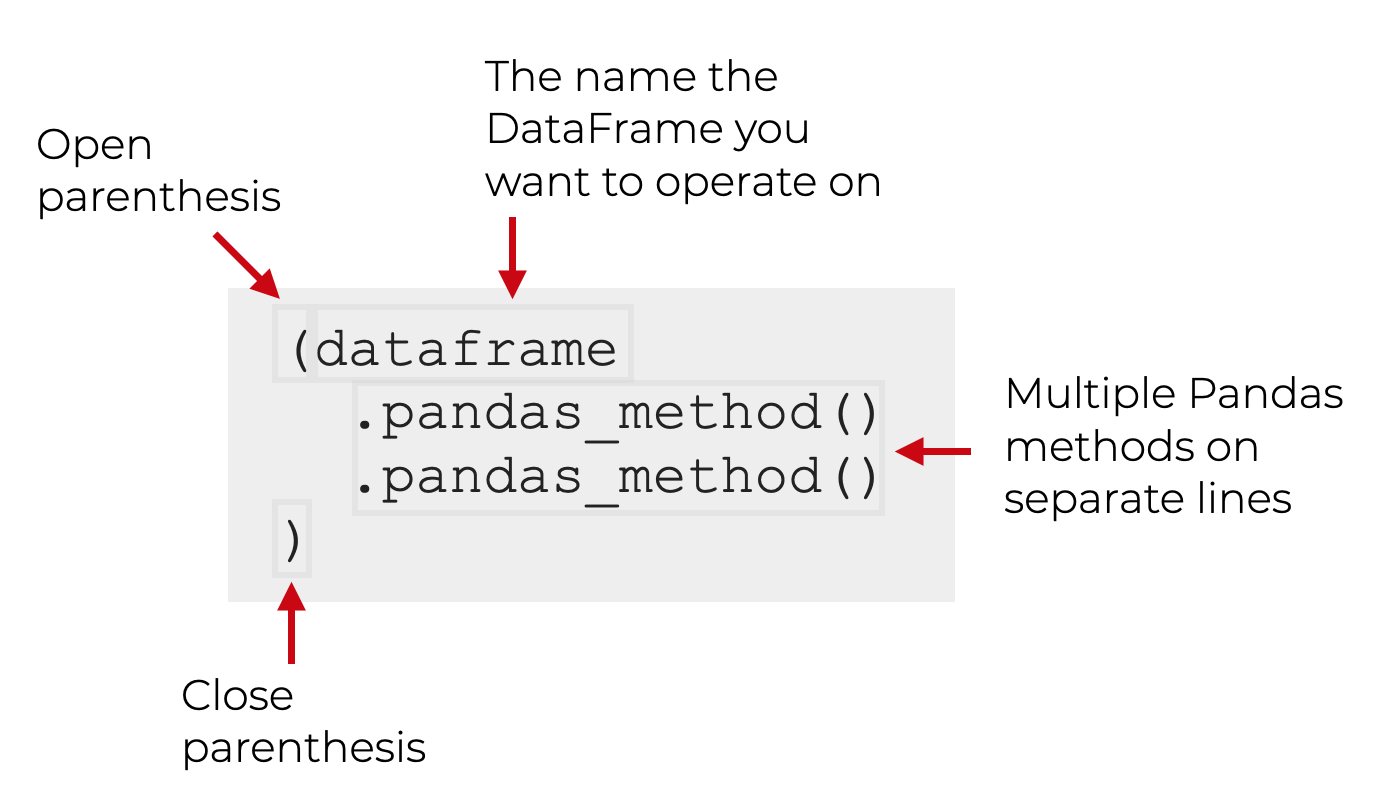
This is critical.
It’s the secret to data cleaning and data wrangling.
It is also one of the secrets for data visualization and analysis.
So once again: master these 19 Pandas methods, and then master how to put them together to do complex data wrangling work.
Discover how to memorize Pandas syntax
If you want a highly effective practice system for memorizing these Pandas data manipulation techniques, you should join our course, Pandas Mastery.
Pandas Mastery is our online course that will teach you these critical data manipulation tools, and show you how to memorize them.
Inside the course, you’ll discover our unique practice system that will enable you to memorize all 19 of these data manipulation tools.
And, it will only take a few weeks.
You can find out more here:
What do you think of the ‘apply’ method?
I often dislike the apply method.
In many cases, the apply method is hard to read and its typically even harder for beginners to understand. Code readability is a big priority for me, so I often dislike when apply is used.
Frequently, its possible to avoid using apply and use something else (although you might need an extra line or two of code, or you might need to break your code out into more than one block).
Again, I avoid it whenever possible.
I see! I don’t have many use cases for ‘apply’ just yet as a beginner but I’m thinking vectorized operations could work. Thanks a lot for the response.
????