The 3 Reasons You Should Learn R for Data Science

An image of the R logo and Python logo, explaining that there are 3 reasons you should learn R for data science.

One of the most common questions I get from data science students is which programming language should I learn for data science, R or Python? The short answer is “it depends.” Both R and Python have strengths and weaknesses as data science languages, or as broader programming languages. So here in this blog post, I … Read more
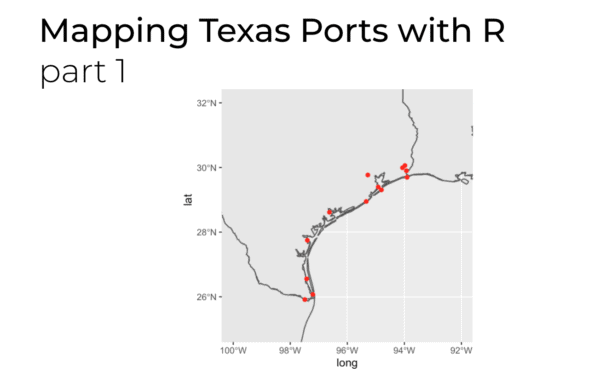
Mapping Texas ports with R [part 1]

An image of Texas ports, mapped along the Texas coastline using R.

In the last few months since covid-19 has struck, everyone is suddenly talking about supply chains. Just a few months ago, this was sort of a “boring” topic, only discussed by import specialists and corporate operations managers. But now, here we are, wondering where our toilet paper is going to come from. I’m being a … Read more

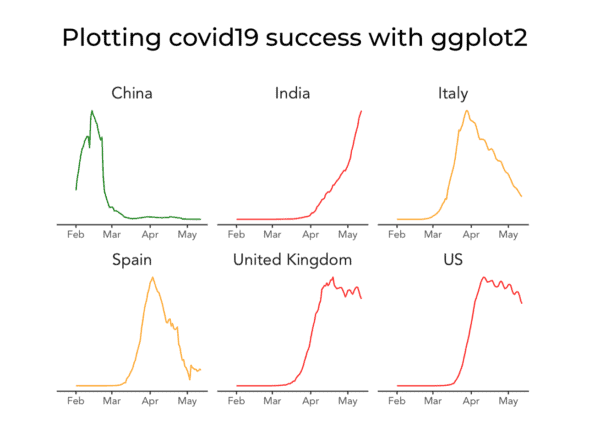
R data analysis, covid19: finding successful countries

A small multiple chart of covid19 data, showing line charts of different countries, where the line is colored red/yellow/green according to the success in reducing new covid19 cases.

In this blog post, we’ll create a data visualization to analyze covid19 data and visualize successful vs. unsuccessful countries. You’ll see exactly what I mean by that in a minute. Our covid19 analysis series: a quick review This tutorial is actually part of a series of tutorials that show how to analyze data with R. … Read more

R Data Exploration: covid-19 [part 3]

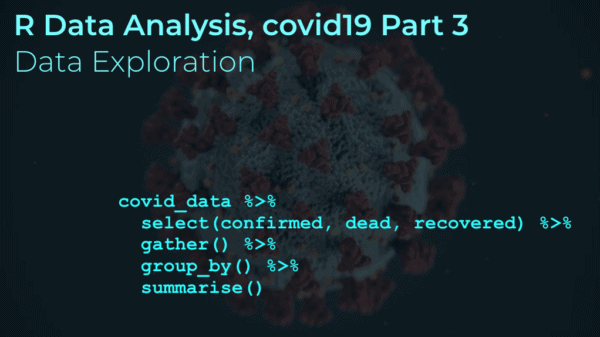
An image of R code analyzing covid19 data, with a sars-cov-2 virus in the background.

This tutorial is part of a series of R tutorials analyzing covid-19 data. For parts 1 and 2, see the following posts: https://www.sharpsightlabs.com/blog/r-data-analysis-covid-19-part1-data-wrangling/ https://www.sharpsightlabs.com/blog/r-data-analysis-covid-19-part-2-merge-datasets/ Covid19 analysis, part 3: initial data exploration So far in our R data analysis series, we’ve spent some time getting and wrangling our data. In part1, we retrieved a single covid19 … Read more

R Data Analysis: covid-19, part 2 [merge datasets]

This tutorial is part of a series of R tutorials analyzing covid-19 data. For part 1, see the following post: https://www.sharpsightlabs.com/blog/r-data-analysis-covid-19-part1-data-wrangling/ Covid19 analysis, part 2: merge datasets In this tutorial, we’re going to set up a process that will enable us to retrieve and wrangle some necessary covid19 datasets … data that we’ll need for … Read more

R Data Analysis: covid-19, part 1 [data wrangling]

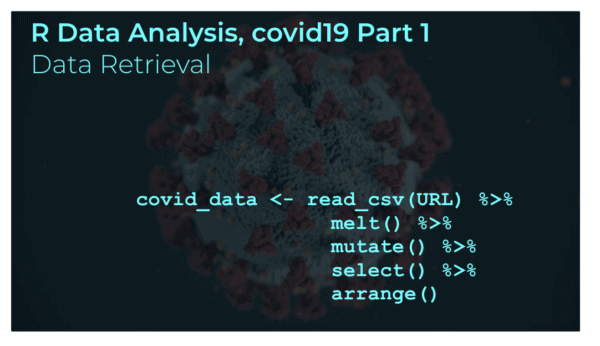
An image of R data manipulation code, with an image of the covid19, sars-cov-2 virus in the background.

In this tutorial, we’re going to analyze covid19 data using R and the Tidyverse. Recently, we started a data analysis series, where we analyzed covid19 data. The first set of these tutorials was performed with Python. That tutorial series was well received, and many people commented that it was very helpful for seeing exactly how … Read more