How to Plot Images with Plotly Imshow
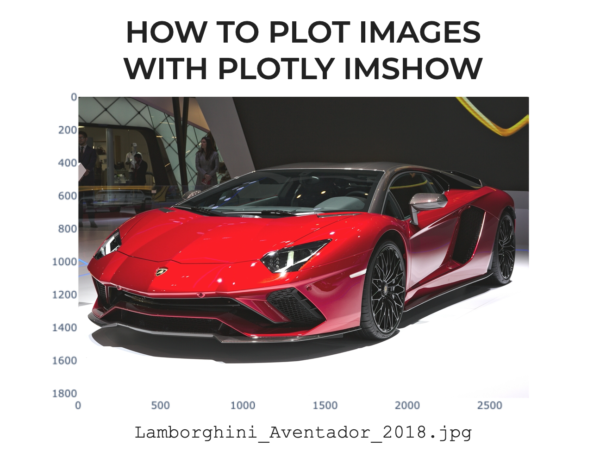
In this tutorial, I’ll show you how to use the Plotly imshow function to display images in Python. So I’ll explain the syntax of px.imshow. I’ll also show you a clear, step-by-step example of how to display an image with Plotly. The tutorial has a few sections, and if you need something specific, just click … Read more