Python Data Analysis: covid-19, part 4 [visual data exploration]

An image of a bar chart with the top 15 countries with the most covid-19 cases.

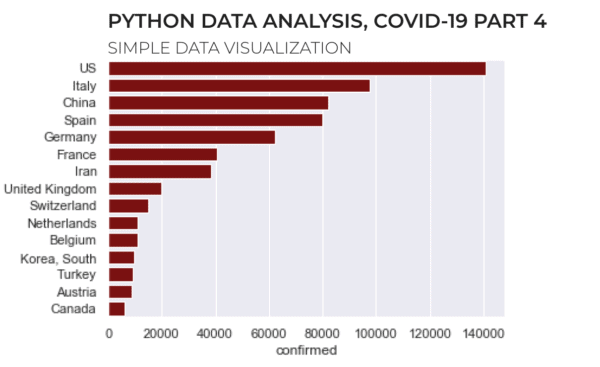
This tutorial is part of a series of tutorials analyzing covid-19 data. For parts 1, 2, and 3, see the following posts: https://www.sharpsightlabs.com/blog/python-data-analysis-covid19-part1/ https://www.sharpsightlabs.com/blog/python-data-analysis-covid19-part2/ https://www.sharpsightlabs.com/blog/analyzing-covid-19-with-python-part-3-eda/ Covid19 analysis, part 4: visual data exploration So far in this tutorial series, we’ve focused mostly on getting data, particularly in parts 1 and 2. Most recently, in part 3, … Read more

How to Make a Seaborn Barplot

A seaborn barplot

This tutorial will show you how to make a Seaborn barplot. The tutorial explains the syntax of sns.barplot, and shows step-by-step examples of how to create bar charts with Seaborn. The tutorial is divided up into several sections. You can click on any of the following links to take you to the appropriate section (if … Read more

How to make a matplotlib bar chart

In this tutorial, you’ll learn how to create a matplotlib bar chart. Specifically, you’ll learn how to use the plt.bar function from pyplot to create bar charts in Python. Bar charts in Python are a little challenging I’ll be honest … creating bar charts in Python is harder than it should be. People who are … Read more

How to make a matplotlib histogram

This tutorial will explain how to make a matplotlib histogram. If you’re interested in data science and data visualization in Python, then read on. This post will explain how to make a histogram in Python using matplotlib. Here’s exactly what the tutorial will cover: A quick introduction to matplotlib The syntax for the matplotlib histogram … Read more

How to use facet_grid in ggplot2

This tutorial will show you how to use facet_grid in ggplot2. Specifically, it will show you how to use facet_grid to create small multiple charts. facet_grid is fairly easy to understand, but it assumes some basic knowledge of ggplot2. ggplot2 is a data visualization package for the R programming language. If you don’t already know … Read more

A ggplot2 tutorial for beginners

This blog post is a fairly comprehensive ggplot2 tutorial for beginners. If you’re new to R and ggplot, this ggplot2 tutorial will cover a few things: What ggplot2 is The syntax of ggplot2 Examples of how to use ggplot2 If you’re new to ggplot, I recommend that you read the whole tutorial. But if you … Read more