How to use facet_grid in ggplot2

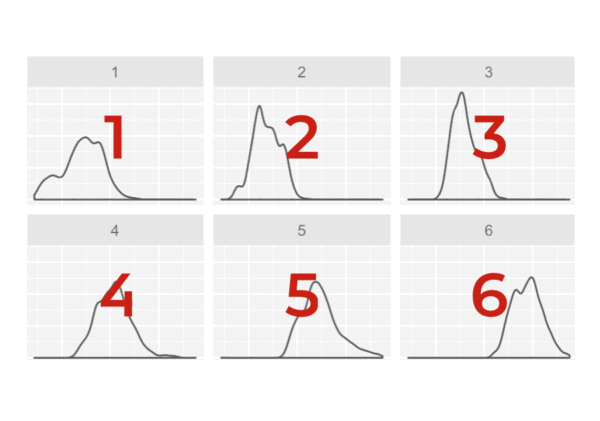
This tutorial will show you how to use facet_grid in ggplot2. Specifically, it will show you how to use facet_grid to create small multiple charts. facet_grid is fairly easy to understand, but it assumes some basic knowledge of ggplot2. ggplot2 is a data visualization package for the R programming language. If you don’t already know … Read more

A ggplot2 tutorial for beginners

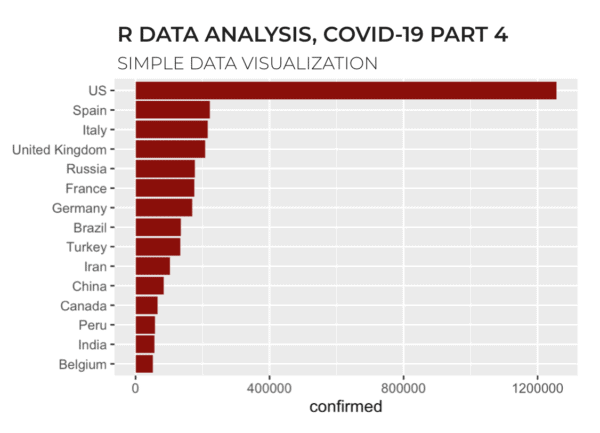
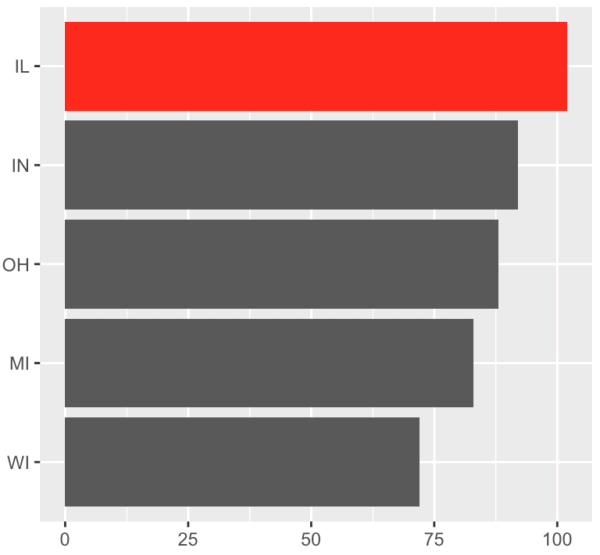
This blog post is a fairly comprehensive ggplot2 tutorial for beginners. If you’re new to R and ggplot, this ggplot2 tutorial will cover a few things: What ggplot2 is The syntax of ggplot2 Examples of how to use ggplot2 If you’re new to ggplot, I recommend that you read the whole tutorial. But if you … Read more

How to use to facet_wrap in ggplot2

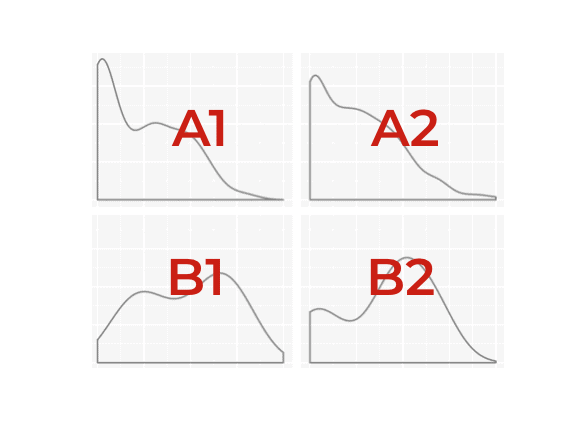
This tutorial will teach you how to use facet_wrap to create small multiple charts in ggplot2. The small multiple design is an incredibly powerful (and underused) data visualization technique. facet_wrap is great, because it enables you to create small multiple charts easily and effectively. It makes it easy to create small multiple charts. Having said … Read more

How to use geom_line in ggplot2

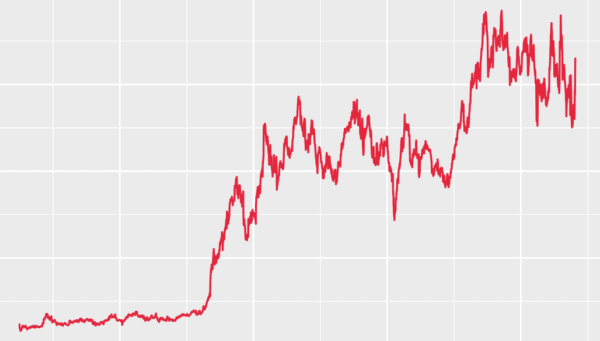
This tutorial will show you how to use geom_line to create line charts with ggplot2. Using geom_line is fairly straight forward if you know ggplot2. But if you’re a relative beginner to ggplot, it can be a little intimidating. That being said, I’m going to walk you through the syntax step by step. We’ll first … Read more

How to make a density plot in R

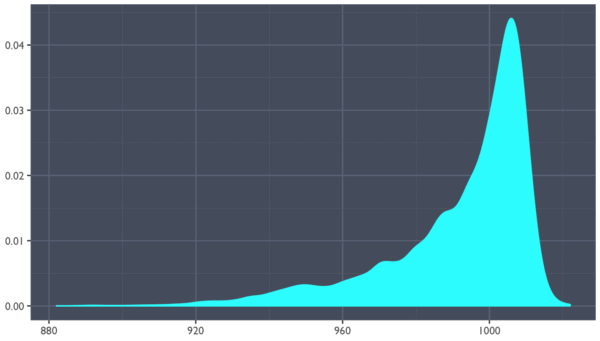
A "polished" r density plot made with ggplot2, without a title or axis titles.

For many data scientists and data analytics professionals, as much as 80% of their work is data wrangling and exploratory data analysis. Of course, everyone wants to focus on machine learning and advanced techniques, but the reality is that a lot of the work of many data scientists is a little more mundane. That isn’t … Read more