You’ve probably heard it before: 80% of your work as a data scientist will be data wrangling.
While that’s sort of a rough number, experience bears out that data wrangling is a massive part of your job as a data scientist.
As such, it pays to know data manipulation. In fact, it pays to be really f*king good at data manipulation.
And when I say that it “pays,” I sort of mean that literally. If you want to get hired and get paid, your data wrangling skills should be solid.
At minimum, you need to know how to do several key data wrangling skills:
- Create new variables
- Sort data
- Summarise data (i.e. calculating summary statistics)
- Select specific columns
- Subset rows
In this blog post, we’ll talk about the last one: how to subset rows and filter your data.

What is the filter() function?
There are several ways to subset your data in R.
For better or for worse though, some ways of subsetting your data are better than others. Hands down, my preferred method is the filter() function from dplyr.
In this blog post, I’ll explain how the filter() function works.
Before I do that though, let’s talk briefly about dplyr, just so you understand what dplyr is, how it relates to data manipulation. This will give you some context for learning about filter().
A quick introduction to dplyr
For those of you who don’t know, dplyr is a package for the R programing language.
dplyr is a set of tools strictly for data manipulation. In fact, there are only 5 primary functions in the dplyr toolkit:
filter()… for filtering rowsselect()… for selecting columnsmutate()… for adding new variablessummarise()… for calculating summary statsarrange()… for sorting data
dplyr also has a set of helper functions, so there’s more than these 5 tools, but these 5 are the core tools that you should know.
Subsetting data with dplyr filter
Let’s talk about some details.
How does filter() work?
How the dplyr filter function works
filter() and the rest of the functions of dplyr all essentially work in the same way.
When you use the dplyr functions, there’s a dataframe that you want to operate on. There’s also something specific that you want to do.
The dplyr functions have a syntax that reflects this.
First, you just call the function by the function name.
Then inside of the function, there are at least two arguments.
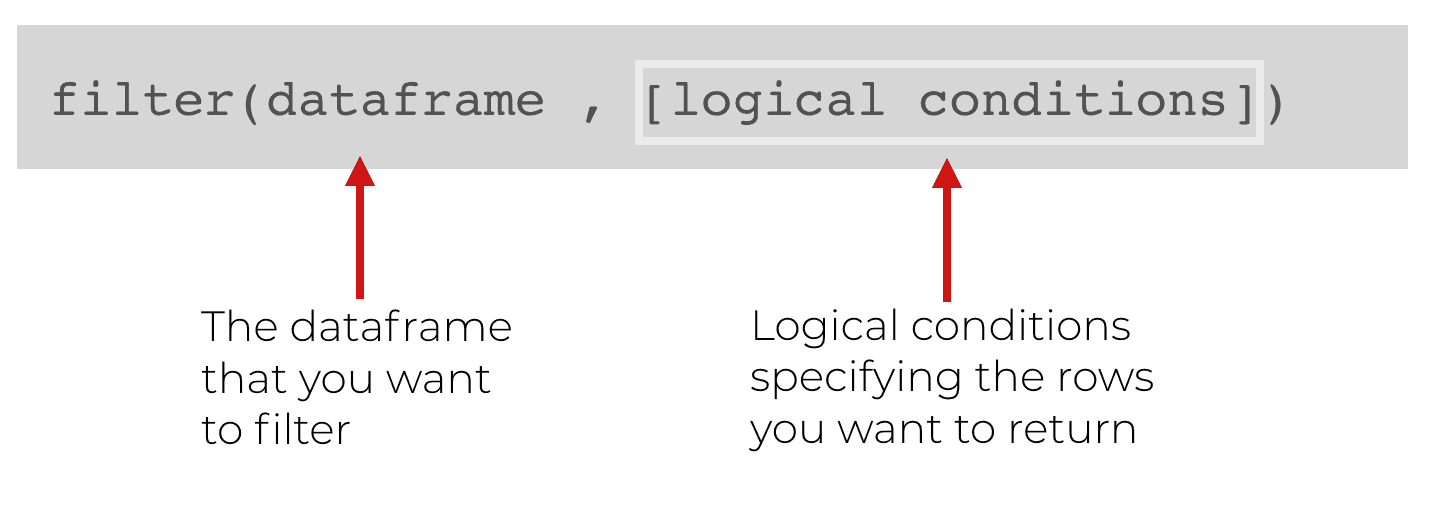
The first argument is the name of the dataframe that you want to modify. In the above example, you can see that immediately inside the function, the first argument is the dataframe.
Next, is exactly how we want to filter the data. To specify how, we will use set of logical conditions to specify the rows that we want to keep. Everything else will get “filtered” out.
Using logic to filter your rows
Since we need to use logic to specify how to filter our data, let’s briefly review how logic works in R.
In R, we can make logic statements that are evaluated as true or false. Remember that R has special values for true and false: True or False.
Ok. Here’s a quick example of a logic statement that you can type into R:
10 > 1
Is 10 greater than 1? Yes! Of course.
As such, R will evaluate a this logic statement as TRUE.
Although this logic statement is fairly simple, logic statements can be more complicated. We can use operators to combine simple logic statements into more complex logic statements.
The simple logical operators are:
&(and)|(or)!(not)
We can use these to combine simple logic conditions into expressions that are more complex. For example:
# A TRUE statement made by combining simple logical expressions
(10 > 1) & (1 != 2)
In the above example we have two simple logic expressions that have been combined with the ‘&‘ operator.
Essentially, this statement is evaluating the following: Is 10 greater than 1 AND is 1 not equal to 2.
This statement is true. It’s true that 10 is greater than 1 and it’s also true that 1 is not equal to 2. Since both are true, the overall statement will be evaluated as true (remember … the & operator requires both sides to be True).
This sort of logic is important if you want to use the dplyr filter function. That being the case, make sure that you understand logic in R. It’s beyond the scope of this blog post to completely explain logic, so if you’re confused by this, you’ll need to do more reading about logic in R.
Why we need logic to use dplyr’s filter function
So why the digression and review of logic in R?
Because you need to use logical expressions to use the filter() function properly.
In some cases, we might want to filter the data with a simple expression … like keeping rows where a variable is greater than 10.
In other cases, we use much more complicated expressions.
But either way, logic is critical.
Examples of how to use the filter() function
So far, the explanation might seem a little abstract, so let’s take a look at some concrete examples.
We’ll start simple, and then increase the complexity.
Having said that, even before we actually filter the data, we’ll perform some preliminary work.
Load packages
First, we’ll just load the tidyverse package. Keep in mind that the tidyverse package is a collection of packages that contains dplyr, ggplot2, and several other important data science packages.
In this blog post, dplyr and ggplot2 are important because we’ll be using both. Obviously, we’ll need dplyr because we’re going to practice using the filter() function from dplyr.
Additionally, we’re going to work with the txhousing dataset, which is included in the ggplot2 package. So, we’ll need to have ggplot2 loaded as well.
Again, loading the tidyverse package will automatically load both dplyr and ggplot2, so we have them both covered.
#-------------
# LOAD PACKAGE
#-------------
library(tidyverse)
Inspect data
Next, we’ll quickly inspect the data.
There are a few ways to do this, but I often use the glimpse() function. glimpse() provides quite a bit of information (like data types, row counts, etc) and the output is well formatted.
#------------------
# INSPECT DATAFRAME
#------------------
glimpse(txhousing)
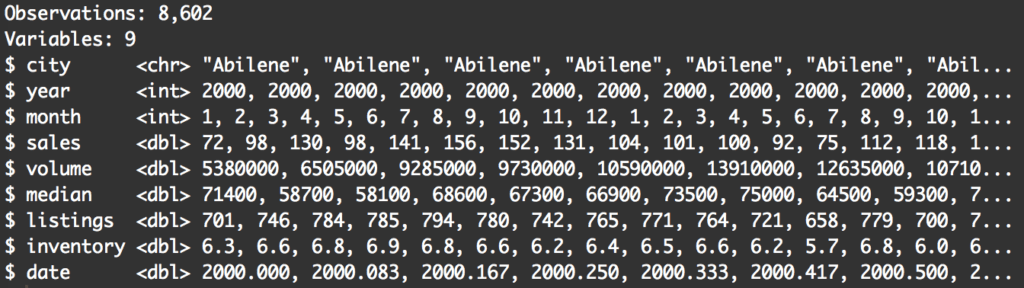
When inspecting your data, you’ll want to pay attention to a few things.
First, you’ll want to look at the variables. Knowing the variables and what they contain will give you a few ideas about how you can filter your data. For example, when looking at the data, I immediately think about filtering the data down to a particular year, or filtering to return records above a particular value for median. Essentially, looking at the data will spark some ideas about how you might want to subset.
Second, pay attention to the number of rows. The total number of rows in a dataset can be a useful piece of information to capture. You might want to write it down in a little notebook as you’re analyzing your data. The reason is that as you filter, subset, and otherwise wrangle your data, it can be useful to know the original number of records.
For example, if you split your data and then perform some manipulations on that data, you might need to check that your two different datasets still collectively contain the same number of rows as the original dataset.
Essentially, knowing the original number of rows can help you “check your work” as you move through an analysis. I won’t discuss data analysis workflow in detail here, but understand that you should pay attention to the number of records.
A simple example of filter()
Let’s start with a very simple example.
filter(txhousing, year == 2001)
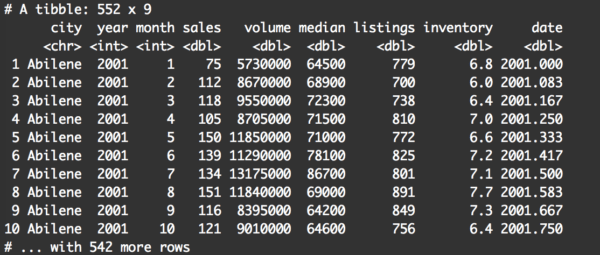
Pay attention to a few things.
First, at a quick glance, it appears that the records were filtered correctly. All of the rows have year equal to 2001.
Second, there are 552 records in the output dataframe. At the very least, this tells us that the filter() operation did create a subset.
As a quick check, we can take a look at the number of observations for every value of year in txhousing:
txhousing %>%
  group_by(year) %>%
  summarise(record_count = n())
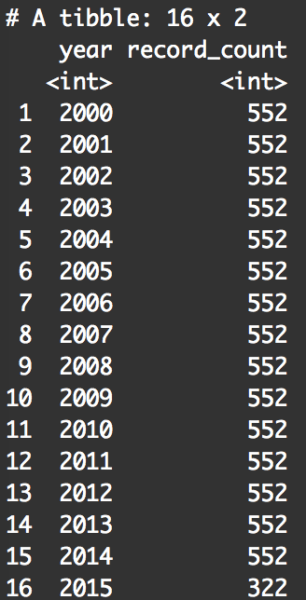
By summarizing the data by year, we can look specifically at the number of records for the year 2001. We’re doing this to check that our filter operation worked correctly. This summary table shows that there is 522 records for the year 2001, which matches the number of records when we filtered our data with filter(txhousing, year == 2001). So, it looked like our use of filter() worked correctly.
Keep in mind, checking your data like this can be useful when you’re performing data manipulation.
Filter data using two logical conditions
In our last example, we filtered the data on a very simple logical condition. We filtered the data and kept only the records where year is exactly 2001.
What if we want to filter on several conditions?
To do that, we need to use logical operators.
Example: year equal to 2001 AND city equal to ‘Abilene’
Let’s take a look at a concrete example. In this new example, let’s extend the previous example. Previously, we filtered the data to keep only the records where year == 2001.
Now, we’ll keep records where year == 2001 and city == 'Abilene'.
Syntactically, here’s what that looks like:
filter(txhousing, year == 2001 & city == 'Abilene')
And here’s the output:
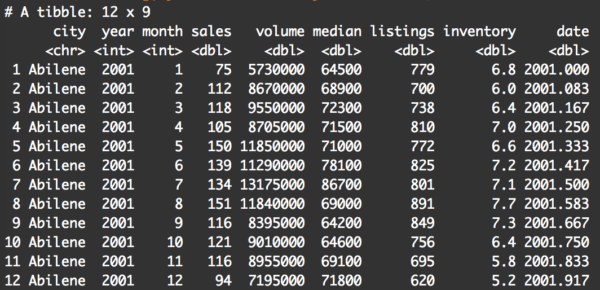
This should make sense if you already understood the previous examples.
We’re still applying the dplyr filter() function. The first argument is the dataframe that we’re manipulating, txhousing.
The next argument (after the comma) is a mildly complex logical statement. Here, we’re telling the filter() function that we only want to return rows of data where the year variable is equal to 2001, and the city variable is equal to 'Abilene'.
Again, this is pretty easy to understand, because the syntax almost reads like pseudocode.
A critical part of this syntax that you need to understand is the “and” operator: &. This requires that both conditions be true. Year must be equal to 2001 and the city must be Abilene. If both conditions are not met for a particular row, that row will be “filtered” out.
So that’s how filter() works. It’s checking logical conditions. If the logical condition or conditions are not met, then the row is filtered out.
Example: city equal Austin OR city equals Houston
Let’s try another example.
Here, we’ll keep rows where city equals Austin or city equals Houston.
To do this, we will use the ‘or’ operator, which is the vertical bar character: |.
filter(txhousing, city == 'Austin' | city == 'Houston')
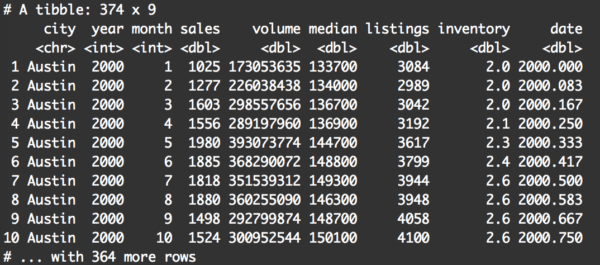
This is very straightforward.
filter() will keep any row where city == 'Austin' or city == 'Houston'. All of the other rows will be filtered out.
Filtering using the %in% operator
Let’s say that you want to filter your data so that it’s in one of three values.
For example, let’s filter the data so the returned rows are for Austin, Houston, or Dallas.
One way of doing this is stringing together a series of statements using the ‘or’ operator, like this:
filter(txhousing, city == 'Austin' | city == 'Houston' | city == 'Dallas')
This works, but frankly, it’s a bit of a pain in the ass. It’s a little verbose.
There’s another way to do this in R using the %in% operator:
filter(txhousing, city %in% c('Austin', 'Houston', 'Dallas'))
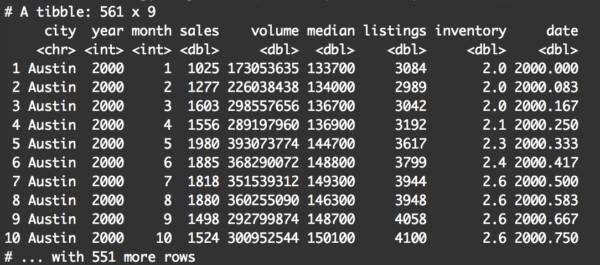
Basically, this returns the records where city is “in” the set of options consisting of Austin, Houston, or Dallas.
It can get more complicated, but master the basics first
Filtering data can get more complicated.
You can filter by using even more complicated logical expressions. There are also other more complicated techniques that you can perform by using functions and dplyr helper functions along with filter().
Having said that, make sure you master the basic techniques first before you start working on more complicated techniques.
A quick warning: save your new dataframes with new names
Before wrapping this up, I want to mention one “quirk” about the filter() function.
This is important, so pay attention …
When you use the filter() function, it does not modify the original dataframe.
Let me show you an example. Here, we’ll use the filter operation on txhousing to filter the data to rows where city == 'Houston'.
filter(txhousing, city == 'Houston')
Now, let’s inspect the data using glimpse().
glimpse(txhousing)

There’s still 8,602 rows. You can immediately see that the data still contains records where the city variable is Abilene.
What the hell?! Didn’t we just filter the data?
Yes, but you need to understand that the filter() function doesn’t change the original dataset. I repeat: filter() does not filter rows out of the input dataset.
Instead, filter() returns a new dataset that contains the appropriate rows.
What that means is that if you run the examples I’ve shown you so far in this blog post, they will not change the original dataset. The new filtered data is just returned and sent directly to the terminal.
If you want to save this new filtered data (instead of having it sent directly to the terminal), you need to save it with a new name using the assignment operator.
For example, you could perform the filter operation above and give the output dataframe a new name: txhousing_houston.
txhousing_houston <- filter(txhousing, city == 'Houston')
Now, if we examine txhousing_houston, you'll see that it contains the appropriate filtered rows.
glimpse(txhousing_houston)
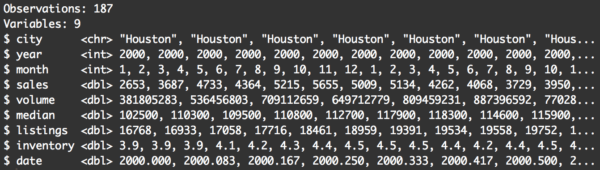
The data now have 187 rows, and at a quick glance, it appears that they are all for records where city is Houston. This looks correct.
Basically, I just want to remind you and reiterate that if you want to save and continue working with the filtered data that comes out of the filter() function, you need to save that data with a new name.
Questions? Leave a comment below
Still confused about the dplyr filter function?
Leave your question in the comments below ...
Say I have a dataset with an ID variable “ID.” And there are 3 other columns, the first is a binomial variable “X” with the next “Y” being a further much more specific identifier with thousands of options. And finally “Z” being the value of interest for each row. So there’s
“ID” “X” “Y” Z”
Is there a way for me to use dplyr filter function to subset only the rows (with all 4 variables) in which for EACH ID, “Y” is represented in both values of “X?”
You’ve got to give me a working example so I can see what you’re talking about more specifically.
If you can give me a working dataset, I can probably help.
Hello,
I would like to master the Data Manipulation and EDA but in the part of Data Manipulation, I’m struggling in terms of base R. Also, on the other hand, I’m finding dplyr very easy for manipulation. How I should I master the manipulation part using both base R and dplyr ? Please give me some guideline about how to practise and how should I start ? I will be very thankful as I’ve become very nervous because, I’m getting errors in small datasets !
Thank you @sharpsight !
For the most part, you should forget about data manipulation with base R.
Use dplyr.
Learn the 5 major “verbs” of dplyr, and practice them over and over with very simple examples until you have the basic techniques completely memorized.
After you’ve memorized the basic techniques, increase the complexity of your practice examples … make things slightly more difficult over time.
Then start combining dplyr with ggplot2 (which you should also memorize by practicing on simple examples).
The basic process:
– Start with simple examples
– Repeat your practice activities until you have the syntax memorized
– Learn new (less common) techniques
– Increase the complexity of your practice activities.
Hi there, I am learning R with tidy verse. I have a question about comparing base R & dplyr. I try to use filter() from dplyr and data[x == 0 ,] on same data set. however, both ways returns different result. what could be the reason?
It’s difficult to tell the exact reason without seeing a working dataset and the results.
If you can post a working example that shows the differences, I might be able to give some insight.
Hi,
I’ve been trying to do operations such as this, do you know why these won’t work after the filter function?
test %>% filter(Name==’Jason’) %>% select(Counter) %>% max()
It’s hard to say exactly because I can’t run your code. To really check this out, you’d need to provide me with a working example that I can run (i.e., a dataframe and some code).
Having said that, take a look at the single quotes surrounding the value Jason.
When I paste your code into R studio, those single quote are “curly” quotes, and don’t function properly.
Straight quotes might fix your problem:
Thanks for the reply, forgot to get back!
But essentially, the filter part of dplyr works but I am having trouble applying a function (like max()) onto the filtered result
oops! just found it, i can use summarise( max = max(Counter))
Thanks though!
Can i use the filter() function in R with out using dplyr package?
Not really. At the very least, you’ll need to have dplyr installed.
Once it’s installed, we typically load it with the code
library(dplyr).Alternatively, if you don’t want to load the whole package, you can call filter alone by using
dplyr::filter()Hi,
Are there helpers for filters similar to the Contains and Starts with helpers in the Select function?
It really depends on what data type you’re working with.
If you’re working with a column that contains string data, then you can use the string manipulation functions from
Stringr.For example:
The above will retrieve rows where the
clarityvariable contains the letter “V.”You can use
str_starts()to detect strings that start with a particular substring, and you can usestr_ends()to detect strings that start with a particular substring. You can also usestr_detectto detect strings based on regular expressions, which can be quite complex.These will probably help you, but again, it really depends on what type of data you’re working with.