This tutorial will explain NumPy axes.
It will explain what a NumPy axis is. The tutorial will also explain how axes work, and how we use them with NumPy functions.
Although it’s probably best for you to read the full tutorial, if you want to skip ahead, you can do so by clicking on one of the following links:
- A quick explanation of NumPy axes
- Examples of how Numpy axes are used
- A warning about axes in 1-dimensional NumPy arrays
- Video Tutorial on Numpy Axes
Before I get into a detailed explanation of NumPy axes, let me just start by explaining why NumPy axes are problematic.
Numpy axes are hard to understand
I’m going to be honest.
NumPy axes are one of the hardest things to understand in the NumPy system. If you’re just getting started with NumPy, this is particularly true. Many beginners struggle to understand how NumPy axes work.
Don’t worry, it’s not you. A lot of Python data science beginners struggle with this.
Having said that, this tutorial will explain all the essentials that you need to know about axes in NumPy arrays.
Let’s start with the basics. I’ll make NumPy axes easier to understand by connecting them to something you already know.
Numpy axes are like axes in a coordinate system
If you’re reading this blog post, chances are you’ve taken more than a couple of math classes.
Think back to early math, when you were first learning about graphs.
You learned about Cartesian coordinates. NumPy axes are very similar to axes in a Cartesian coordinate system.
An analogy: cartesian coordinate systems have axes
You probably remember this, but just so we’re clear, let’s take a look at a simple Cartesian coordinate system.
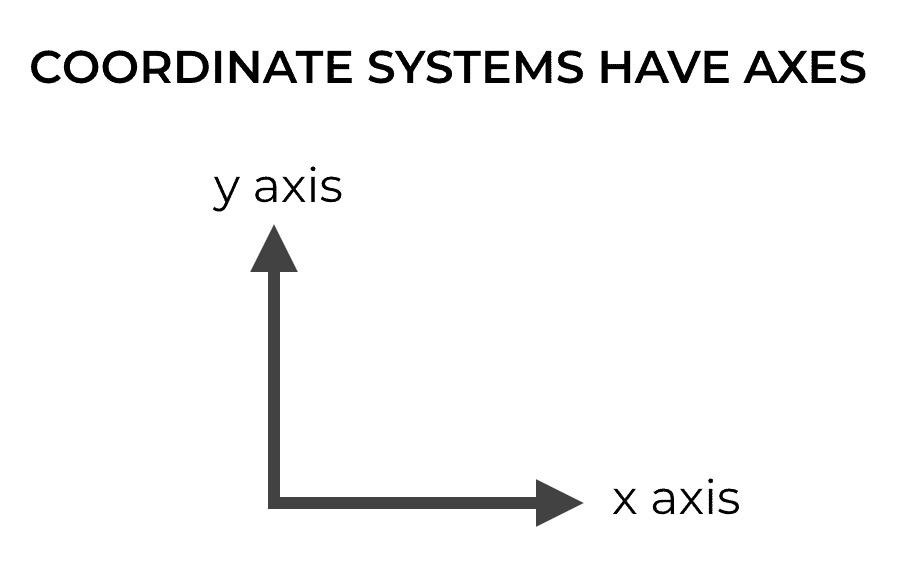
A simple 2-dimensional Cartesian coordinate system has two axes, the x axis and the y axis.
These axes are essentially just directions in a Cartesian space (orthogonal directions).
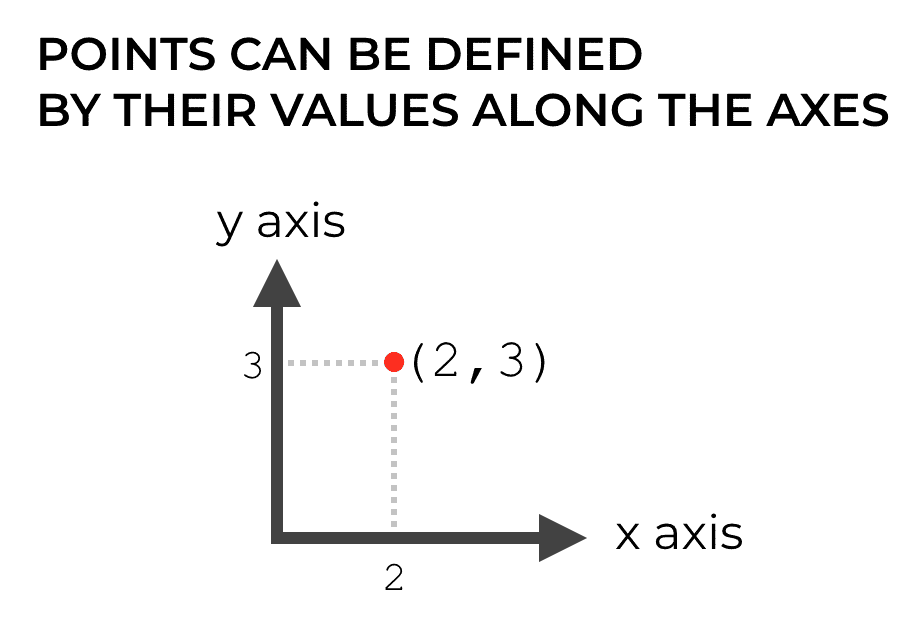
Moreover, we can identify the position of a point in Cartesian space by it’s position along each of the axes.
So if we have a point at position (2, 3), we’re basically saying that it lies 2 units along the x axis and 3 units along the y axis.
If all of this is familiar to you, good. You’re half way there to understanding NumPy axes.
NumPy axes are the directions along the rows and columns
Just like coordinate systems, NumPy arrays also have axes.
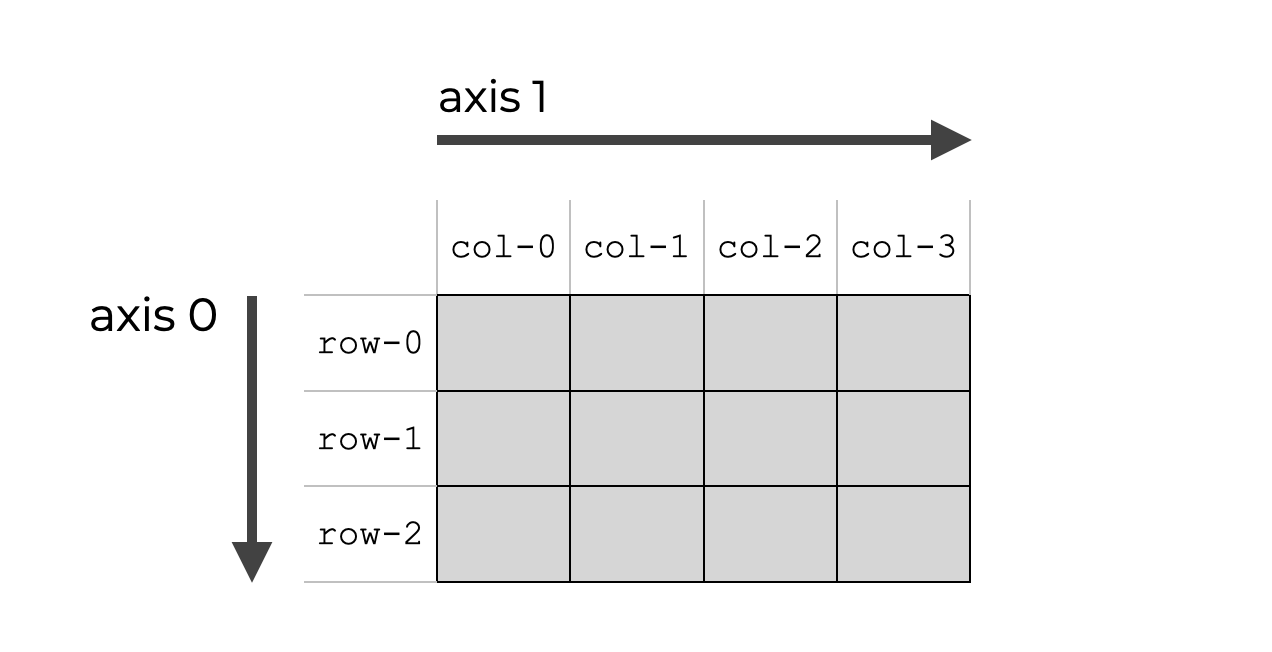
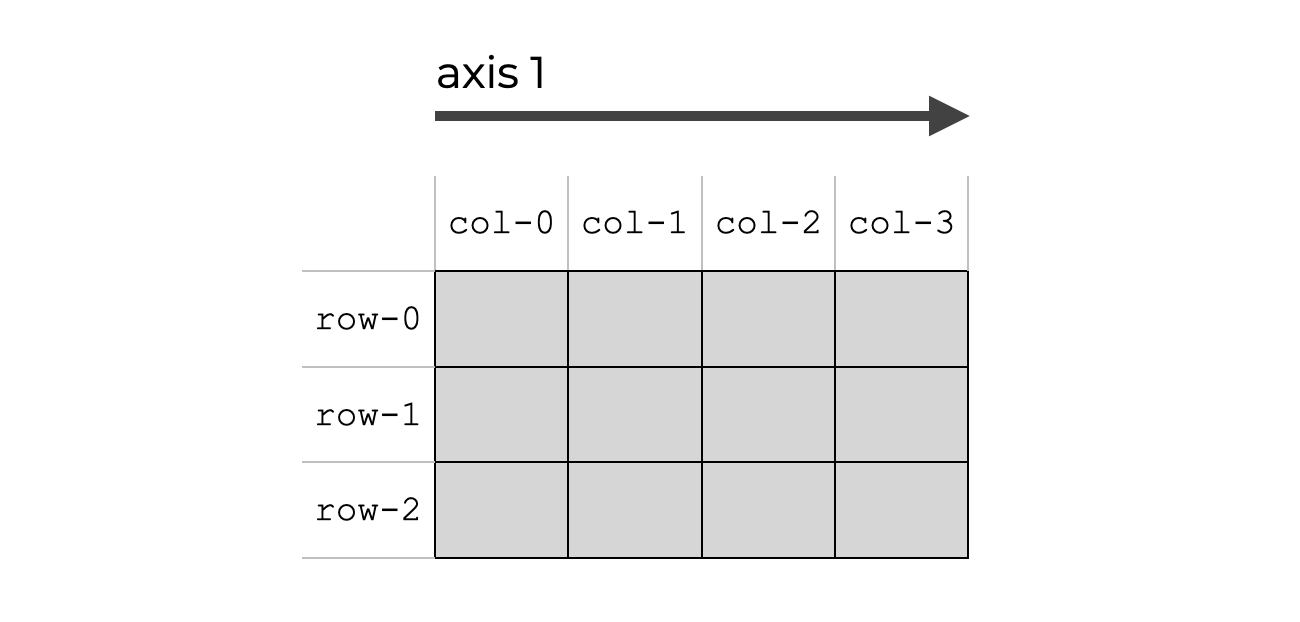
In a 2-dimensional NumPy array, the axes are the directions along the rows and columns.
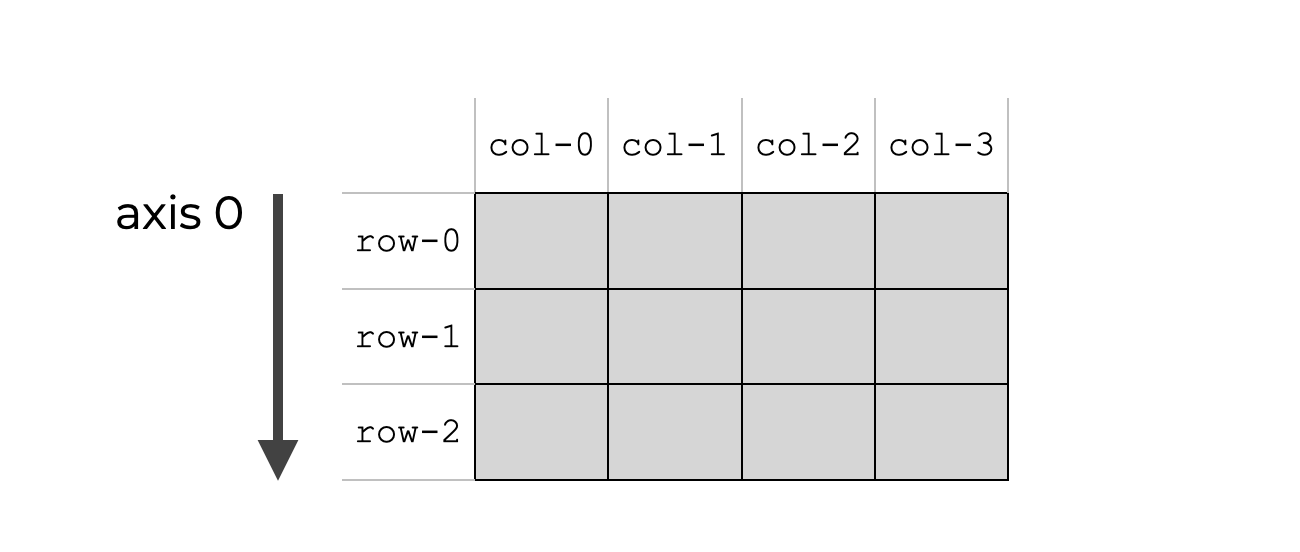
Axis 0 is the direction along the rows
In a NumPy array, axis 0 is the “first” axis.
Assuming that we’re talking about multi-dimensional arrays, axis 0 is the axis that runs downward down the rows.
Keep in mind that this really applies to 2-d arrays and multi dimensional arrays. 1-dimensional arrays are a bit of a special case, and I’ll explain those later in the tutorial.
Axis 1 is the direction along the columns
In a multi-dimensional NumPy array, axis 1 is the second axis.
When we’re talking about 2-d and multi-dimensional arrays, axis 1 is the axis that runs horizontally across the columns.
Once again, keep in mind that 1-d arrays work a little differently. Technically, 1-d arrays don’t have an axis 1. I’ll explain more about this later in the tutorial.
NumPy array axes are numbered starting with ‘0’
It is probably obvious at this point, but I should point out that array axes in NumPy are numbered.
Importantly, they are numbered starting with 0.
This is just like index values for Python sequences. In Python sequences – like lists and tuples – the values in a the sequence have an index associated with them.
So, let’s say that we have a Python list with a few capital letters:
alpha_list = ['A','B','C','D']
If we retrieve the index value of the first item (‘A‘) …
alpha_list.index('A')
… we find that ‘A‘ is at index position 0.
Here, A is the first item in the list, but the index position is 0.
Essentially all Python sequences work like this. In any Python sequence – like a list, tuple, or string – the index starts at 0.
Numbering of NumPy axes essentially works the same way. They are numbered starting with 0. So the “first” axis is actually “axis 0.” The “second” axis is “axis 1,” and so on.
The structure of NumPy array axes is important
In the following section, I’m going to show you examples of how NumPy axes are used in NumPy, but before I show you that, you need to remember that the structure of NumPy arrays matters.
The details that I just explained, about axis numbers, and about which axis is which is going to impact your understanding of the NumPy functions we use.
Having said that, before you move on to the examples, make sure you really understand the details that I explained above about NumPy axes.
And if you have any questions or you’re still confused about NumPy axes, leave a question in the comments at the bottom of the page.
Ok. Now, let’s move on to the examples.
Examples of how Numpy axes are used
Now that we’ve explained how NumPy axes work in general, let’s look at some specific examples of how NumPy axes are used.
These examples are important, because they will help develop your intuition about how NumPy axes work when used with NumPy functions.
Run this code before you start
Before we start working with these examples, you’ll need to run a small bit of code:
import numpy as np
This code will basically import the NumPy package into your environment so you can work with it. Going forward, you’ll be able to reference the NumPy package as np in our syntax.
A word of advice: pay attention to what the axis parameter controls
Before I show you the following examples, I want to give you a piece of advice.
To understand how to use the axis parameter in the NumPy functions, it’s very important to understand what the axis parameter actually controls for each function.
This is not always as simple as it sounds. For example, in the np.sum() function, the axis parameter behaves in a way that many people think is counter intuitive.
I’ll explain exactly how it works in a minute, but I need to stress this point: pay very careful attention to what the axis parameter actually controls for each function.
Numpy sum
Let’s take a look at how NumPy axes work inside of the NumPy sum function.
When trying to understand axes in NumPy sum, you need to know what the axis parameter actually controls.
In np.sum(), the axis parameter controls which axis will be aggregated.
Said differently, the axis parameter controls which axis will be collapsed.
Remember, functions like sum(), mean(), min(), median(), and other statistical functions aggregate your data.
To explain what I mean by “aggregate,” I’ll give you a simple example.
Imagine you have a set of 5 numbers. If sum up those 5 numbers, the result will be a single number. Summation effectively aggregates your data. It collapses a large number of values into a single value.
Similarly, when you use np.sum() on a 2-d array with the axis parameter, it is going to collapse your 2-d array down to a 1-d array. It will collapse the data and reduce the number of dimensions.
But which axis will get collapsed?
When you use the NumPy sum function with the axis parameter, the axis that you specify is the axis that gets collapsed.
Let’s take a look at that.
Numpy sum with axis = 0
Here, we’re going to use the NumPy sum function with axis = 0.
First, we’re just going to create a simple NumPy array.
np_array_2d = np.arange(0, 6).reshape([2,3])
And let’s quickly print it out, so you can see the contents.
print(np_array_2d)
[[0 1 2]
 [3 4 5]]
The array, np_array_2d, is a 2-dimensional array that contains the values from 0 to 5 in a 2-by-3 format.
Next, let’s use the NumPy sum function with axis = 0.
np.sum(np_array_2d, axis = 0)
And here’s the output.
array([3, 5, 7])
When we set axis = 0, the function actually sums down the columns. The result is a new NumPy array that contains the sum of each column. Why? Doesn’t axis 0 refer to the rows?
This confuses many beginners, so let me explain.
As I mentioned earlier, the axis parameter indicates which axis gets collapsed.
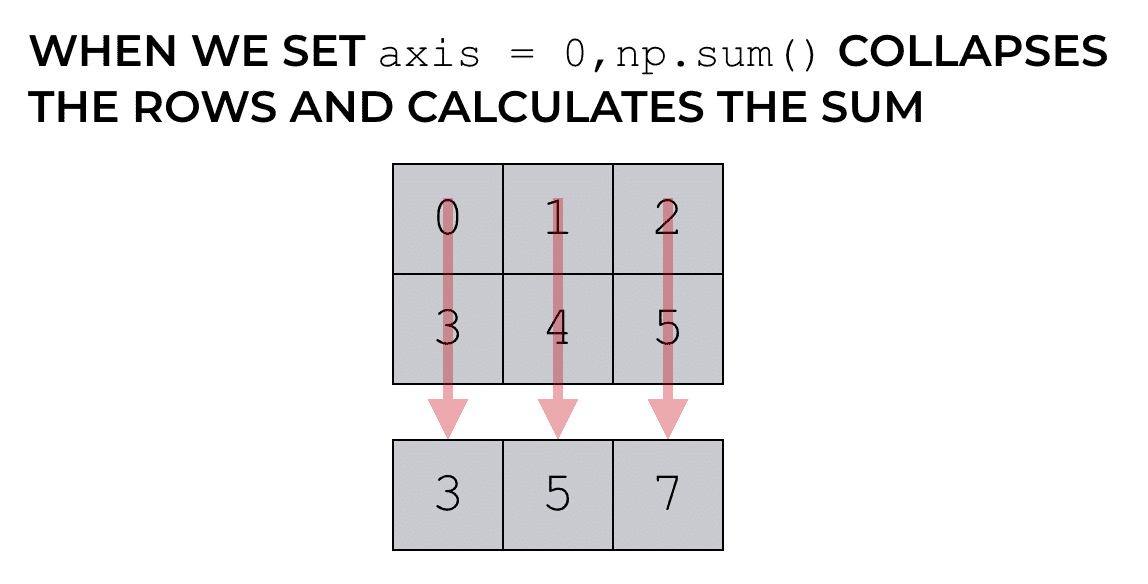
So when we set axis = 0, we’re not summing across the rows. When we set axis = 0, we’re aggregating the data such that we collapse the rows … we collapse axis 0.
Numpy sum with axis = 1
Now, let’s use the NumPy sum function on our array with axis = 1.
In this example, we’re going to reuse the array that we created earlier, np_array_2d.
Remember that it is a simple 2-d array with 6 values arranged in a 2 by 3 form.
print(np_array_2d)
[[0 1 2]
 [3 4 5]]
Here, we’re going to use the sum function, and we’ll set the axis parameter to axis = 1.
np.sum(np_array_2d, axis = 1)
And here’s the output:
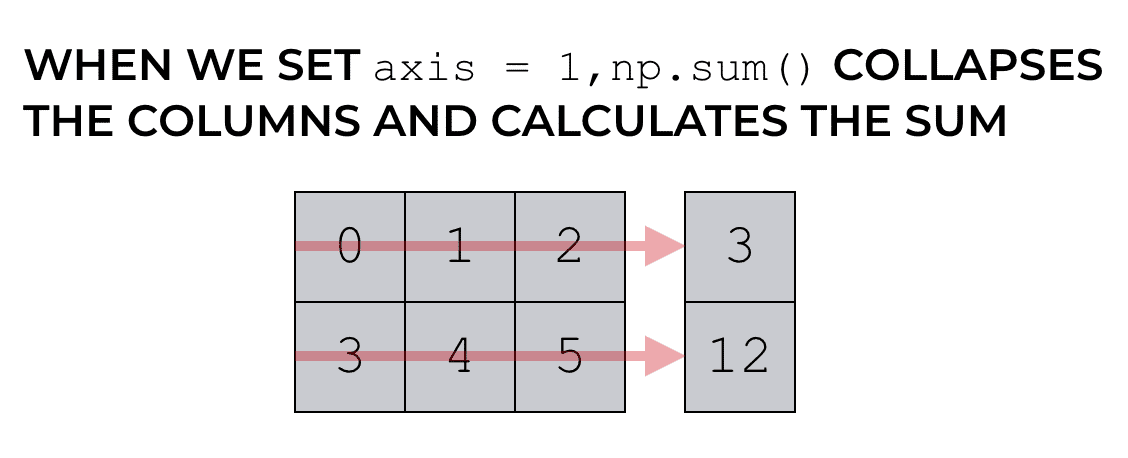
array([3, 12])
Let me explain.
Again, with the sum() function, the axis parameter sets the axis that gets collapsed during the summation process.
Recall from earlier in this tutorial that axis 1 refers to the horizontal direction across the columns. That means that the code np.sum(np_array_2d, axis = 1) collapses the columns during the summation.
As I mentioned earlier, this confuses many beginners. They expect that by setting axis = 1, NumPy would sum down the columns, but that’s not how it works.
The code has the effect of summing across the columns. It collapses axis 1.
Numpy concatenate
Now let’s take a look at a different example.
Here, we’re going to work with the axis parameter in the context of using the NumPy concatenate function.
When we use the axis parameter with the np.concatenate() function, the axis parameter defines the axis along which we stack the arrays. If that doesn’t make sense, then work through the examples. It will probably become more clear once you run the code and see the output.
In both of the following examples, we’re going to work with two 2-dimensional NumPy arrays:
np_array_1s = np.array([[1,1,1],[1,1,1]])
np_array_9s = np.array([[9,9,9],[9,9,9]])
Which have the following structure, respectively:
array([[1, 1, 1],
       [1, 1, 1]])
And:
array([[9, 9, 9],
       [9, 9, 9]])
Numpy concatenate with axis = 0
First, let’s look at how to use NumPy concatenate with axis = 0.
np.concatenate([np_array_1s, np_array_9s], axis = 0)
Which produces the following output:
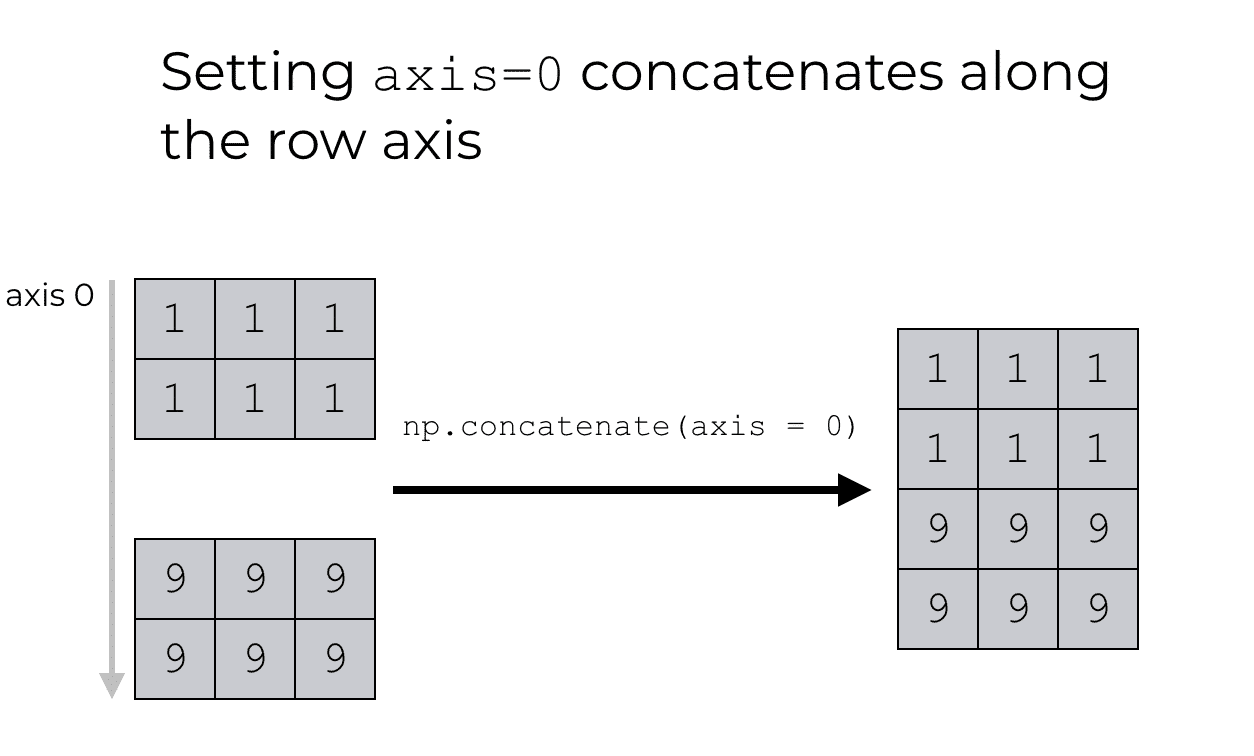
array([[1, 1, 1],
       [1, 1, 1],
       [9, 9, 9],
       [9, 9, 9]])
Let’s carefully evaluate what the syntax did here.
Recall what I mentioned a few paragraphs ago. When we use the concatenate function, the axis parameter defines the axis along which we stack the arrays.
So when we set axis = 0, we’re telling the concatenate function to stack the two arrays along the rows. We’re specifying that we want to concatenate the arrays along axis 0.
Numpy concatenate with axis = 1
Now let’s take a look at an example of using np.concatenate() with axis = 1.
Here, we’re going to reuse the two 2-dimensional NumPy arrays that we just created, np_array_1s and np_array_9s.
We’re going to use the concatenate function to combine these arrays together horizontally.
np.concatenate([np_array_1s, np_array_9s], axis = 1)
Which produces the following output:
array([[1, 1, 1, 9, 9, 9],
       [1, 1, 1, 9, 9, 9]])
If you’ve been reading carefully and you’ve understood the other examples in this tutorial, this should make sense.
However, let’s quickly review what’s going on here.
These arrays are 2 dimensional, so they have two axes, axis 0 and axis 1. Axis 1 is the axis that runs horizontally across the columns of the NumPy arrays.
When we use NumPy concatenate with axis = 1, we are telling the concatenate() function to combine these arrays together along axis 1.
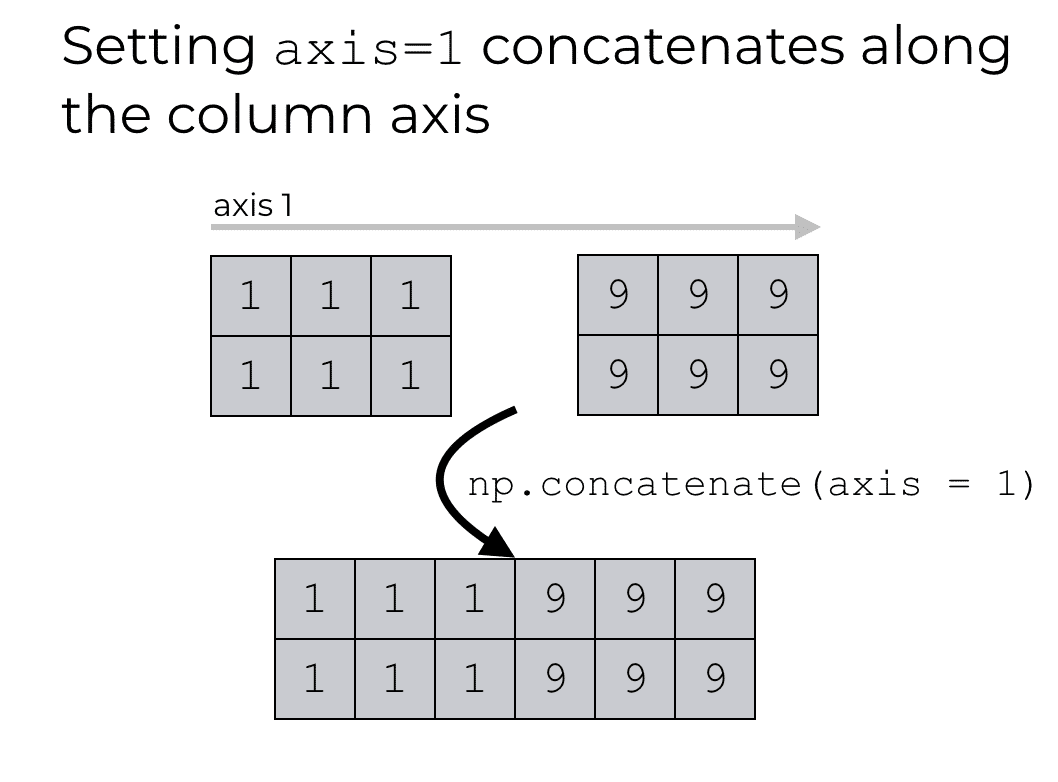
That is, we’re telling concatenate() to combine them together horizontally, since axis 1 is the axis that runs horizontally across the columns.
Warning: 1-dimensional arrays work differently
Hopefully this NumPy axis tutorial helped you understand how NumPy axes work.
But before I end the tutorial, I want to give you a warning: 1-dimensional arrays work differently!
Everything that I’ve said in this post really applies to 2-dimensional arrays (and to some extent, multi-dimensional arrays).
The axes of 1-dimensional NumPy arrays work differently. For beginners, this is likely to cause issues.
Having said all of that, let me quickly explain how axes work in 1-dimensional NumPy arrays.
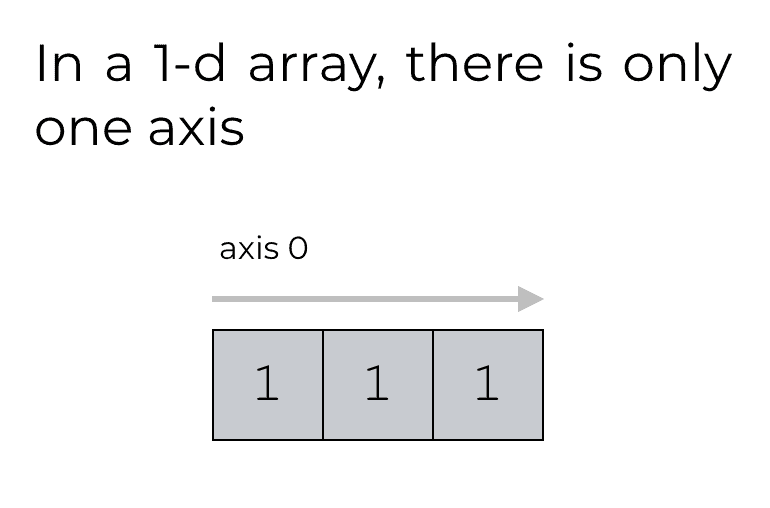
1-dimensional NumPy arrays only have one axis
The important thing to know is that 1-dimensional NumPy arrays only have one axis.
If 1-d arrays only have one axis, can you guess the name of that axis?
Remember, axes are numbered like Python indexes. They start at 0.
So, in a 1-d NumPy array, the first and only axis is axis 0.
The fact that 1-d arrays have only one axis can cause some results that confuse NumPy beginners.
Example: concatenating 1-d arrays
Let me show you an example of some of these “confusing” results that can occur when working with 1-d arrays.
We’re going to create two simple 1-dimensional arrays.
np_array_1s_1dim = np.array([1,1,1])
np_array_9s_1dim = np.array([9,9,9])
And we can print them out to see the contents:
print(np_array_1s_1dim)
print(np_array_9s_1dim)
Output:
[1 1 1]
[9 9 9]
As you can see, these are two simple 1-d arrays.
Next, let’s concatenate them together using np.concatenate() with axis = 0.
np.concatenate([np_array_1s_1dim, np_array_9s_1dim], axis = 0)
Output:
array([1, 1, 1, 9, 9, 9])
This output confuses many beginners. The arrays were concatenated together horizontally.
This is different from how the function works on 2-dimensional arrays. If we use np.concatenate() with axis = 0 on 2-dimensional arrays, the arrays will be concatenated together vertically.
What’s going on here?
Recall what I just mentioned a few paragraphs ago: 1-dimensional NumPy arrays only have one axis. Axis 0.
The function is working properly in this case. NumPy concatenate is concatenating these arrays along axis 0. The issue is that in 1-d arrays, axis 0 doesn’t point “downward” like it does in a 2-dimensional array.
Example: an error when concatenating 1-d arrays, with axis = 1
Moreover, you’ll also run into problems if you try to concatenate these arrays on axis 1.
Try it:
np.concatenate([np_array_1s_1dim, np_array_9s_1dim], axis = 1)
This code causes an error:
IndexError: axis 1 out of bounds [0, 1)
If you’ve been reading carefully, this error should make sense. np_array_1s_1dim and np_array_9s_1dim are 1-dimensional arrays. Therefore, they don’t have an axis 1. We’re trying to use np.concatenate() on an axis that doesn’t exist in these arrays. Therefore, the code generates an error.
Be careful when using axes with 1-d arrays
All of this is to say that you need to be careful when working with 1-dimensional arrays. When you’re working with 1-d arrays, and you use some NumPy functions with the axis parameter, the code can generate confusing results.
The results make a lot of sense if you really understand how NumPy axes work. But if you don’t understand NumPy array axes, the results will probably be confusing.
So make sure that before you start working with NumPy array axes that you really understand them!
To learn data science in Python, learn NumPy
As you’ve seen in this tutorial, NumPy axes can be a little confusing. They are especially confusing to NumPy beginners.
But, in order to use NumPy correctly, you really need to understand how NumPy axes work.
Moreover, if you want to learn data science in Python, you need to learn how NumPy axes work. That’s because working with axes is critical for using NumPy, and NumPy is a critical part of the Python data science ecosystem.
Sign up now
Do you want to learn more about NumPy and data science in Python?
If you’re interested in data science in Python, then sign up for our email list.
Every week, we publish articles and tutorials about data science. We publish tutorials about NumPy and other aspects of data science in Python.
If you sign up, these tutorials will be delivered directly to your inbox.
You’ll get free tutorials on:
- NumPy
- Pandas
- Base Python
- Scikit learn
- Machine learning in Python
- Deep learning
- … and more.
Want to learn data science in Python? Sign up now.
Thank you so much for the post. It is quite clear to me now.
My catch is that when ‘axis = 0’ is set to a 2d-array, the direction of calculation/aggregation is carried out along the vertical direction, and ‘axis = 1’ means the calculation/aggregation is done horizontally.
I would like to see more on python for data science. I just started to learn python recently.
Yes, it’s best to think about NumPy axes as directions long which we can perform operations.
And BTW … we’re going to be posting a lot more about data science in Python.
We’ll still have R tutorials too, but we’ll moving into Python teaching in a serious way.
Thank you for this post. you talked about 1-D array being special case.However, I would like to know more about numpy with 3-D and how , slicing, point locating and functions are affected by that 3rd dimension. Regards
3D is more complicated but much of the underlying conceptual structure (and syntax) from the 2D case extends to the 3D case.
We might create a future tutorial about 3D numpy arrays in the future that explains 3D….
thank you for the reply.
the confusion comes from which index represents which axis. if I want to map each index of numpy array to a Cartesian axis (I am using numpy array for a geometric problem) which one is going to be x, y and z. you don’t have to worry about positive/negative direction of an axis.
In a 2D case, first index is the y axis in Cartesian, and second index is the x axis in Cartesian
If we use the same reasoning in 3D case, first index is y, second index is x, and third index is z. is this correct?
regards
Not quite ….
This is best explained by an image, but we don’t have one here at Sharp Sight right now.
Here’s an analogy though.
Imagine you’re looking at note cards in a box of cards.
Each card has rows and columns, and then there are many cards in the box.
The rows of each card will be axis 0.
The columns of each card will be axis 1.
And the direction of new cards will be axis 2, so as you flip through the different cards in the box, you’ll be moving along the axis 2 direction.
Again, this is best explained with an image, so I’ll probably create a blog post about this in the future.
In the meantime, you can do a google image search for “3D numpy array” and you’ll find some images that show what it looks like.
That reply confusing me. It rather looks like every new dimension start to be 0 axis. Comparing to your example with cards it seems to be axis 0 is card number, axis 1 is row on the card and axis 2 is column on the card. So if I get cards[n,r,c] then I get element from n-th card in r-th row and c-th colum. So np.sum(cards, axis=0) will collaps all cards to one card.
No, Mateusz, the correct dimensions for the card example are [r,c,n]
Thanks…this really helps. Would you help me understand what axis = -1 or ‘last axis’ as I’ve read!
I literally mean the last axis in the array.
So for example, if you’re working with a 2-dimensional NP array, you will have 2 axes: axis-0 and axis-1.
Python orders the axes in numerical order, so axis-0 is the first axis, next is axis-1, etc.
When I say “last” axis, I mean the “final” axis. So in a 2-dimentional NP array, the “last” axis is axis-1 … for the case of a 2-d array,
axis = -1refers to axis-1.This changes though if you have an array with more axes. So if you have a 3-dimensional array, the “last” axis will be axis-2 … a 3D array has 3 axis …. axis-0, axis-1, and axis-2, so axis-2 is the “last” axis for a 3D array.
Thank You so much for the post. This post really helped me in understanding axes and how they work in numpy. Great one. Please is there a post on axes for 3D array ? Looking forward to seeing one.
There’s no posts on 3D arrays yet, but several people have asked so we’ll probably make one eventually.
What exactly are you struggling with with respect to 3D arrays? If you have specific issues or questions, we can try to address them in a future lesson.
Thank you so much for explaining the concept behind axis. could you please explain it for 3 d arrays also. It will be a great help.
Definitely on my list of topics to cover in our blog posts.
There’s a good chance that I’ll update this blog post in the future to cover 3D arrays.
This is one of the best written tutorial I have ever read. Everything is explained from basics. If I have any issue is you saying that some of the aspects are going to difficult when they are not or at least you explain in to not. I think that gives you more credit
Thank you!
Thanks a lot. This has helped me a lot.
You’re welcome.
Clearly explained
Thank you for posting a very beginner friendly tutorial
You’re welcome
Thank you soo much. Great explanation.
Wow, this is one of those missing articles on using Numpy, Pandas, Scikit-learn stack. Great explanation.
Yeah, the Python tools are great, but the documentation often leaves students a little confused.
Axes are one of those really important things that most new students don’t understand …
… so, we tried to write the article that would explain it.
PS: if you like it, share it
That’s a great explanation! A real help
Thank you!
If you like this tutorial and our other free tutorials, the best thing that you can do to support them is to share them on social media …
Can you please explain how the axis parameter works for the np.delete function?
Briefly:
If you use
axis = 0,np.deletewill remove a row.If you use
axis = 1,np.deletewill remove a column.Frankly, I don’t like this syntax.
This has been a very huge help.
Great to hear
Like reading a nice noble and just curious to know more, your sight name deserves it.
excellent clear explanation. Thank you.
using the word ‘along the direction’ , makes this concept clear.
your diagrams also very understandable.
Yeah, axes are much easier to understand once you start thinking of them as directions.
Good to hear that this helped you.
Good post.
I gotta question, What is about axis = 2 ?
Looking for your explanation.
Axis 2 applies to 3-dimensional arrays (or higher dimensional arrays).
For a 3D array:
– axis 0 points downwards against the rows
– axis 1 points horizontally across the columns
– axis 2 points inward, through the 3D layers
What’s interesting is that computers can not only think but also perform operations in the 4th or, if need be, in the fifth dimension as well – a task that is not intuitive for humans to visualize. Our intuition is constrained by the limitations of the physical world. Sure I can have time be the 4th dimension, but what is the 5th? Do we need a fifth dimension?
What is the difference between a dimension and a column in a data frame? Why not have a data frame with 4 columns [length, breadth, width, time] to locate an object? I suppose dimensions are only for visualization. A data frame can help me capture many more “dimensions” simultaneously and it would not be very un-intuitive. What are your thoughts?
Thank you!!!! I’ve been working with numpy for about 4 years and every time I wanted to use a numpy aggregate function, I would try it with the axis parameter set to 1 and 0 because I didn’t understand what the convention was – until now! So thank you!
You’re welcome …
This is really one of the most confusing things about Numpy.
The real secret: whenever you see “axis” replace the word with “direction”
Then things will really make sense …
Thank you sharp sight. This post addressed the exact concern I had – how the axis parameter operates differently in the sum and concatenate function. In the sum function, the axis argument actually stands for the axis to be aggregated and NOT the axis along which to sum (as my intuition would have me believe). Could I have found out the same had I read the documentation? Who knows! But for the lot of us who are brave enough to learn python on the fly, you are certainly the saviour of choice! :)
Very helpful. I am now very clear on how to use NumPy arrays. Thank you so much.
Thank you. It saved a lot of burn for me. :-) Neat explanation.
Just curious, do you know why has Numpy named the 0 and 1 axis this way?
Axis 0 = rows
Aix 1 = columns
The other way round would have made more intuitive sense. Isn’t it?
Axis 0 is always the axis that lists the observations themselves.
Take a look at a 1-dimensional array, and you’ll get a hint. For a 1D array, the first and only axis is axis 0 … it’s the axis that enumerates the observations themselves.
Another way to gain some insight is to look at a Pandas dataframe, which is built on top of a 2D Numpy array.
In a Pandas dataframe, just like for a 2D Numpy array, axis 0 points downward. Axis 0 enumerates the individual records (the rows), and axis 1 lists attributes associated with those records (i.e., columns).
Axis 0 is always the axis that lists the observations.
Very bad explained , people can’t find whatever they searching. Remove extra stuff which is more than anything :/
Ok, what were you searching for that was so hard to find?
I can’t improve the tutorial if you just post vague negative criticism.
It was one of the most clearest explanations on axes ive ever come across ..
I think you lack patience to go through the material my friend.
nice tutorial, couldn’t ask it to be more clearer
Thank you very much. You helped me to understand this very topic. Fantastic from you and the team
Do you have a paper textbook or tutorial videos that you sell over learning Python? I am learning Python and data science and I really like the way you explain codes step by step with the Python ‘reasoning’ behind the codes. If you do have courses or textbooks please let me know! Thank you for your tutorials!
We have several Python and R courses, but enrollment opens only a few times per year.
You can find our course list by clicking on the “Courses” link at the top of the page … and there you can sign up for a waitlist for individual courses.
I just finished reading NumPy’s “The Basics” section, which left me so confused in the end. I then searched and found your article, and now, thanks to you, I completely understand. Promptly, I can proceed with finishing the quickstart guide.
That’s great to hear.
Why was NumPy’s “The Basics” section so difficult to understand?
Hey, thanks a lot for this article!
helped a lot!
You’re welcome
Very good explanation., thanks it helped me.
one improvement suggestion: you emphasize that 0 is the ‘first’ axis, 1 the second and so on.., but for me you don’t quite emphasize enough what is the first second third etc.
Is it that the 0th is the innermost array , as in an array : A of arrays ,B,C,D , where B,C, D are 1-D arrays of size N then summing across axis 0 means summing the inner arrays to get one array of size N.
Nice post????
I like it too. ????????????
Here’s how I’ve learned to keep track of NumPy axis directions:
* axis -1 (the last axis) always points to the right
* axis -2 (the next to last axis) always points down
* axis -3 points in the stacking direction
These work for 1D, 2D, and 3D arrays.
Great post, this helps so much thank you!
You talked about a 1-D array being special – I was wondering if you do want to concatenate two 1-D arrays (as columns) together, how can you do that without getting the error ”IndexError: axis 1 out of bounds [0, 1)”?
You need to reshape both of the 1D arrays to 2D arrays.
You can do that with the Reshape method:
.reshape(-1,1)Once they’re reshaped, you can use concatenate or Hstack to stack them together.
It will look something like this:
I just wanna say, thank you. A really excellent explanation. You are a very good as a teacher. Thanks again
You’re welcome.
Thanks for this!
I think I can clarify the thing about the 1-D arrays. The issue isn’t that the axis is inconsistent. It’s the representation. In 2-D array examples you present the first dimension vertically, and the second dimension horizontally. With the 1-D array you represent the first dimension horizontally.
If you present each dimension consistently, then the 0th axis looks consistent.
Yes, that’s exactly right.
Axes for 1D arrays confuse people because of how they appear when they are printed out.
Regardless, the heuristic of axis-0 is vertical, axis-1 is horizontal only works for 2D and multi-D arrays.
Thank you for good tutorial!
You’re welcome.
One improvement. To match indexes with row labels you should label: row-0, row-1, row-2 in your pictures. Likewise for columns.
Totally agree.
I’ve changed the images so the labels in the image match the actual indexes.
import numpy as np
x = np.array([[1, 1], [2, 2]])
print(x)
print(x.sum(axis=1))
for the above code , shouldn’t the output be
[[2
4]] i.e there were 2 columns before and that got collapsed to 1 column (but still it remains a 2D array) instead of [2 4]?
No, when we perform a summary operation along an axis (like sum, mean, median, etc), Numpy will *collapse* that dimension.
Said differently, when we perform a summary operation, Numpy will effectively remove that dimension, and reduce the total number of dimensions in the array.
That’s the *default* behavior.
However, you can change this so that Numpy *keeps* the dimension by setting “
keepdims = True”The code will look like this:
you really answer readers’ questions, thank you for your time and patience. For one and two dimension arrays, you explained them quite well. My worry is that I can get the result quickly from the operation on 3 or 4 or above dimension array like two D array. For example, if a is a 2-D array, I sum it along an axis I can quickly know which numbers should be summed to get the answer. But for like 4-D array, It will take me a lot of effort to know which numbers should be added together along an axis like 3. My way is to fix all the other axes, leave only the third axis to be changed so that you will get a bunch of numbers, add them you will get a number with axis associated to it, i.e those axes you didn’t change in this round of adding calculation. keep doing this you will get the result for a sum of 4-d array along axis 3. Is my understanding correct?
This was so helpful and clear. Thank you for the detailed examples and explanations.
You’re welcome.
Very thorough explanation. Thanks.
You’re welcome. ???? ????
Merci pour ces claires et précises explications.
De rien.
For me, the topic of axis in Numpy arrays was always confused. The explanation to understand the axis on this page is very clear and concise. Thank you!
Great to hear that this post helped.
I agree that axes are pretty confusing (and usually poorly explained) so I tried to make this crystal clear.
it is helpful brother
????????????
Thanks for the clear explanations.
It’s was very helpful.
You’re welcome.
“Clear explanations” is what I try to do here.
I really enjoyed the way you explain step by step. It helps me to understand the concept without any confusion. Thanks a lot!
You’re welcome.
Best explanation of NumPy axes I’ve ever found on internet. Very well explained.
????
Useless. Please explain the lay out of 3 D and then axes and then sum().
Such gracelessness and sense of entitlement.
You’re a lowly person unworthy of more of my help.
Very nice explanation, quite elaborative.
Thank you for the compliment.
Hi
This is very helpful. Thanks for covering in detail.
Could you please explain few examples with 2 arrays and map the positions in first array using cond on 2nd array.
for ex:- players in first array, scores in 2nd array and identify the position of players based on cond applied in scores array…
much appreciated. Thanks
I’m not entirely sure what you’re trying to do, but I’ll take a guess.
If you have two arrays (e.g.,
playersandscores), you can either create a boolean mask with thescoresarray to retrieve the names of theplayers, or you can simply use np.where to find the locations in thescorematrix that match a specific condition (and it will return the indexes).Hmm, time for a bit of mnemonic for 1-dim array.. I think.
Is it correct that a 1-dim array,(equivalent to a list in python), is located on Row 0 hence Axis 0, the equivalent to the value of y in an upside down Cartesian coordinate ie 0 or a Cartesian axes reflected on the x axis?????
Thanks so much.
This tutorial is excellent.
????????????
My cath is:
In case of one dimensional array, we have only one axis and the value of it is 0. (axis=0)
In case of two dimensional arrays, we have only two axes and the values of them are 0, and 1. (The first axis is 0 and the second axis is 1)
In case of one dimensional arrays we collapse the arrays horizontally.
In case of two dimensional arrays we collapse the arrays based on axis_value.
If axis = 0, so collapse the rows vertically.
If axis = 1, so collapse the cols vertically.
Not exactly …. we collapse the array along the direction of the axis.
Just think about the axis as a direction, and we’re collapsing along that direction.
Thanks a lot ????????
Overly complex explanation for a simple concept.
Wrong.
Most people are very confused by the axes concept. As seen in almost all the comments above, I clarify this concept for almost everyone who reads this post.
(PS: If you want to be an asshole, go do it on your own blog.)