This tutorial will explain how to use the Numpy variance function (AKA, np.var).
In the tutorial, I’ll do a few things. I’ll give you a quick overview of the Numpy variance function and what it does. I’ll explain the syntax. And I’ll show you clear, step-by-step examples of how we can use np.var to compute variance with Numpy arrays.
Each of those topics is handled in a separate section. You can click on any of the following links, and it will take you to that section.
Table of Contents:
Having said that, if you’re new to Numpy, or need a quick refresher on what “variance” is, you should probably read the whole tutorial.
A Quick Introduction to Numpy Variance
First of all, let’s start with what the variance function does.
The Numpy variance function calculates the variance of values in a Numpy array.
At a high level, that’s really all it does?
To help you understand this though, let’s do a quick review of what variance is, as well as a review of Numpy arrays.
Variance Measures the Dispersion of a Set of Numbers
In statistics, variance is a measure of the dispersion of a set of numbers. Another way of saying this, is that variances measures how spread out a set of numbers is.
Specifically, the variance of a set of numbers is the average of the squared deviations from the mean.
So if we have a dataset with N numbers, can compute variance as follows:
(1) 
Where:
 = the individual values in the dataset
 = the number of values in the dataset
 = the mean of the values
To be honest, computing variance by hand is sort of a pain in the a**. This is especially true when we have a large amount of numbers.
Thankfully, we can use computers to compute variance for us.
Numpy Variance Computes the Variance on Numpy Arrays
In particular, when you’re using the Python programming language, you can use the np.var function to calculate variance.
Let’s quickly review Numpy and Numpy arrays.
Numpy is a Python Package for Working with Numeric Data Organized in Arrays
Numpy is a package for working with numeric data.
For the most part, Numpy operates on a data structure called a Numpy array.
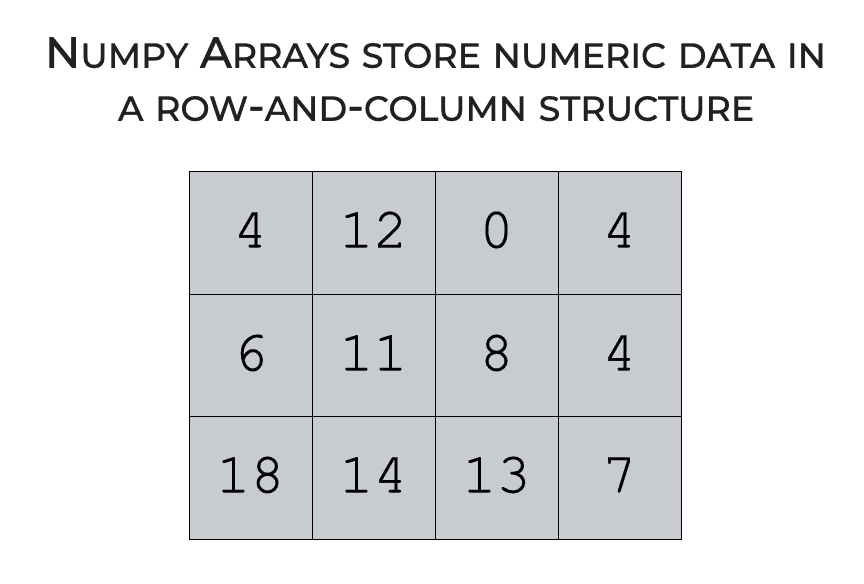
A Numpy array is a row-and-column data structure that contains numeric data.
So obviously, we can use Numpy arrays to store numeric data.
But Numpy also has a variety of functions for operating on Numpy arrays.
For example, we have tools like Numpy power, which calculates exponents, and Numpy log, which calculates the natural logarithm.
We have tools for reshaping Numpy arrays, like the Numpy reshape method.
And then we have statistical functions that compute statistics on the Numbers in an array.
For example we have functions like Numpy mean and Numpy Max, which compute the mean and maximum, respectively.
We have Numpy standard deviation, which computes the standard deviation.
And of course, we have Numpy variance, which as I’ve stated, computes the variance.
The point here is that Numpy is a toolkit for working with data that’s organized in Numpy arrays, and Numpy variance is one of those tools.
Having said that, the specifics of how these functions work depends on the syntax.
So to understand Numpy variance in detail, you need to understand the syntax.
Let’s take a look at the syntax for np.var.
The syntax of np.var
The syntax of the Numpy variance function is fairly straight forward, but there are a few important details.
Let’s start with the basics.
A quick note: the exact syntax depends on how you import Numpy
One important thing that you need to know is that the exact syntax depends on how you’ve imported Numpy. (Remember: before you can use the Numpy package, you need to import Numpy into your code.)
Among Python programmers and data scientists, the common convention is to import Numpy with the alias ‘np‘.
You can do that with the following code:
import numpy as np
If you import Numpy with this alias, you can call the Numpy variance function as np.var().
Ok, that being said, let’s take a closer look at the syntax.
np.var syntax
At a high level, the syntax for np.var looks something like this:
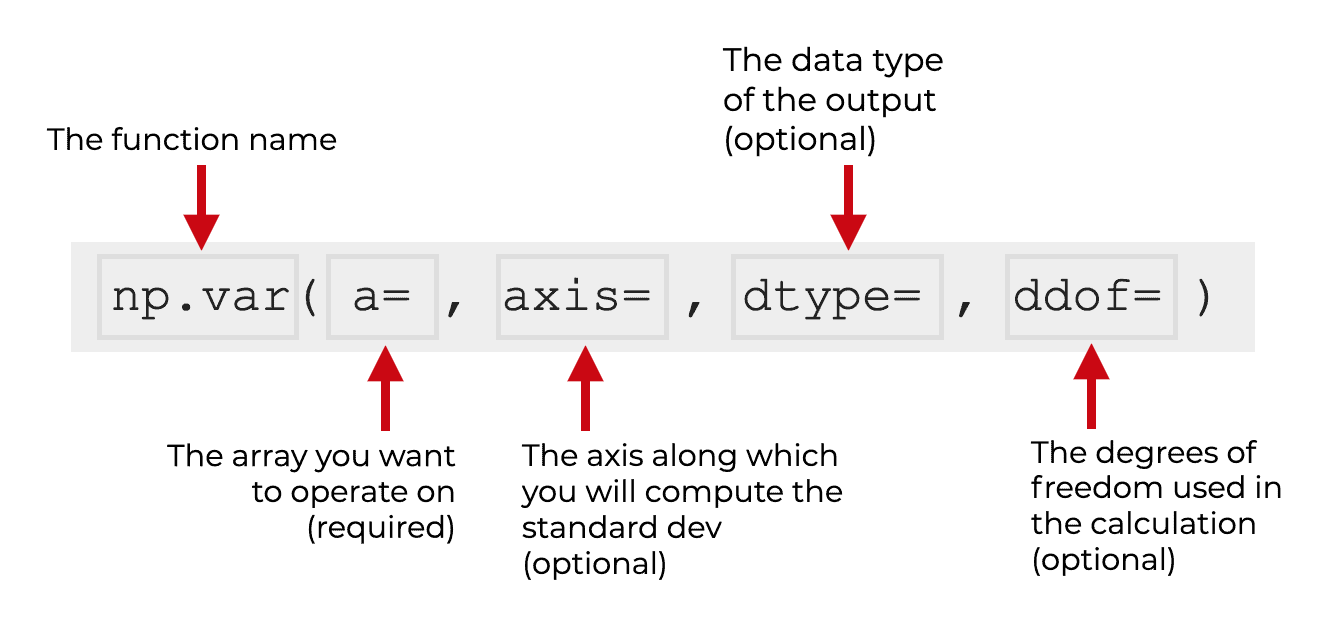
We typically call the function as np.var(). Again, this assumes that we’ve imported Numpy with the alias np.
Then inside of the parenthesis, there are several parameters that control the exact behavior of the function.
Let’s look at those parameters.
The parameters of numpy.std
There are a few important parameters you should know for the np.var function:
aaxisdtypeddofkeepdimsout
Let’s take a look at these one at a time.
a (required)
First of all, we have the a parameter.
The a parameter enables you to specify the input values or input array that you want to operate on. The argument to this parameter will be the array of values for which you want to compute the variance.
This input can actually take a few possible forms. You can provide a Numpy array as the argument to this parameter, but you can also use “array like” objects. These include Python lists and similar Python sequences.
Keep in mind that you must provide an argument to this parameter (since the argument to this parameter is the input to the function).
Having said that, you don’t need to explicitly use this parameter. So for example, if you have an input array called myarray, you can call the code as np.var(a = myarray), OR you can remove the a = and just use the code np.var(myarray). Again, you don’t need to explicitly type the a parameter.
I’ll show you examples of this in example 1.
axis
(optional)
The axis parameter enables you to specify an axis on which to compute the variance.
If you don’t understand axes, then I recommend that you read our tutorial about Numpy axes.
Having said that, here’s a quick overview.
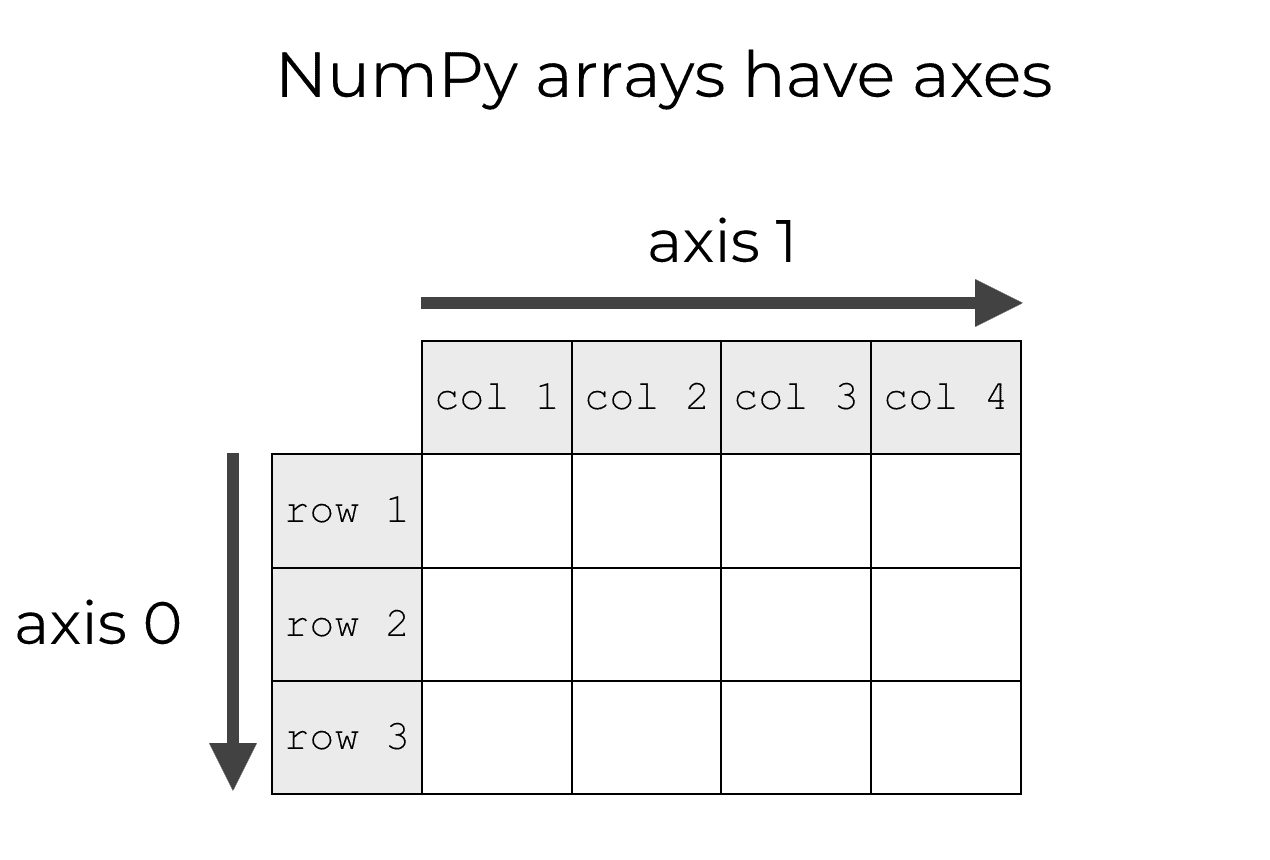
Numpy arrays have axes. Axes are like directions (much like the x and y axes in a Cartesian space).
By default, if we don’t use the axis parameter, np.var will ignore the axes and compute the variance of all of the numbers in the array.
However, if you do use the axis parameter, then we can instruct np.var to compute the variance (e.g., compute the variance in the axis-0 direction, along the axis-1 direction, etc).
This enables you to compute things like the row variances and column variances.
As I said earlier, to really understand this, you need to understand how axes work. That said, I’ll show you some examples in the examples section, to help you understand.
dtype
(optional)
The dtype parameter specifies the data type to use when computing the variance.
If the values in the input array are floats, then dtype will default to the same type of float as the input values.
If the values in the input array are integers, then dtype will default to float64.
Otherwise, you can manually specify an alternative datatype using the dtype parameter.
ddof
(optional)
The ddof parameter enables you to specify the “degrees of freedom” for the variance calculation, and it typically has to do with whether we’re calculating a population variance or a sample variance.
To understand this, it helps to look again at exactly how we compute variance.
![\[ variance_{population} = \frac{1}{N} \displaystyle\sum_{i=1}^N (x_i - \overline{x})^2 \]](https://www.sharpsightlabs.com/wp-content/ql-cache/quicklatex.com-4cab8b5e9116fc149498d6ea3e4aa82a_l3.png "Rendered by QuickLaTeX.com")
Notice that when we calculate variance for a population, the first term in the equation is  . Here, would be the total number of values in your Numpy array or dataset.
But in statistics, the computation changes slightly when we calculate the variance for a sample.
When we calculate the variance for a sample, we replace with  , where
  is the number of elements in the sample, such that:
![\[ variance_{sample} = \frac{1}{n - 1} \displaystyle\sum_{i=1}^n (x_i - \overline{x})^2 \]](https://www.sharpsightlabs.com/wp-content/ql-cache/quicklatex.com-56e2e6b30e059b1bfa9d103ff5b3d04e_l3.png "Rendered by QuickLaTeX.com")
Ultimately, what you need to understand is that the variance calculation is typically different for a population vs a sample.
Now back to Numpy …
To implement this in Numpy, we can use the ddof parameter.
This enables you to specify the “degrees of freedom” for the calculation
When we use ddof, it will modify the variance calculation to become:
(2) 
By default, ddof is set to 0, which is appropriate when you compute a population variance.
And you can set it to ddof = 1 for a sample variance.
If I’m being honest, this is a little complex and difficult to understand. If you’re interested in learning more about this, you can check out this tutorial on Khan academy.
out
(optional)
The out parameter enables you to specify an output array in which to put the output of the function.
This output array should have the same shape as the expected output.
keepdims
(optional)
The keepdims parameter enables you to force np.var to “keep” the same number of dimensions in the output as there were in the input.
To understand this, think about what happens when we use the Numpy variance function.
When we use np.var, we’re taking an input array, possibly with multiple dimensions, and we’re summarizing that multi-dimensional structure down to a single number as an output.
So if your input array has 2 dimensions, and you use np.var with the default setting, it’s going to produce a floating point number (a scalar value) as an output.
The input might have multiple dimensions, but the output will be a scalar.
But what if you want to have the same number of dimensions in the output? What if you want that output number to be formatted as a 2-dimensional Numpy array (so that the output has the same dimensions as the input).
You can do that with the keepdims parameter.
By default, keepdims is set to keepdims = False, which means that np.var does not keep the dimensions the same. If the input array is multi-dimensional, the output will have fewer dimensions.
But if you set keepdims = True, Numpy will keep the dimensions the same in the output as they were in the input.
To be clear, this is a little hard to understand without an example.
So let’s move on to some examples of Numpy variance.
Examples: how to compute the variance with Numpy
Here, we’ll work through a few examples of the Numpy variance function.
We’ll start with a simple example and then increase the complexity from there.
Examples:
- Calculate variance of a 1-dimensional array
- Calculate the variance of a 2-dimensional array
- Use np.var to compute the variances of the columns
- Use np.var to compute the variances of the rows
- Change the degrees of freedom
- Use the keepdims parameter in np.var
Run this code first
Before you run any of these examples, you need to import the Numpy module.
You can do that with the following code:
import numpy as np
This will import Numpy with the alias “np“.
EXAMPLE 1: Calculate variance of a 1 dimensional array
In this example, we’ll simply calculate the variance of a 1 dimensional Numpy array.
Create 1D array
First, we’ll create our 1-dimensional array:
array_1d = np.array([12, 14, 99, 72, 42, 55, 72])
Calculate standard dev
Next, we’ll calculate the variance of the numbers in the array.
np.var(array_1d)
OUT:
880.2040816326529
Explanation
Here, Numpy variance computed the variance of the numbers [12, 14, 99, 72, 42, 55, 72] using equation 1 from earlier in the tutorial.
One quick note
In this example, we didn’t explicitly use the a= parameter. But notice that the function still worked.
That’s because the np.var() function understands that if the a parameter is absent, then the argument in the first position should be interpreted as the argument to the a parameter.
Having said that, it’s also possible to explicitly use the a= parameter, like this:
np.var(a = array_1d)
OUT:
880.2040816326529
EXAMPLE 2: Calculate the variance of a 2-dimensional array
Next, in this example, we’ll calculate the variance of a 2-dimensional Numpy array.
Create 2-dimensional array
First, we’ll create a 2D array of integers with Numpy random randint.
np.random.seed(22)
array_2d = np.random.randint(size =(3, 4), low = 0, high = 20)
This Numpy array has 3 rows and 4 columns.
Let’s also print out the array, so we can see the contents:
print(array_2d)
OUT:
[[ 4 12  0  4]
 [ 6 11  8  4]
 [18 14 13  7]]
As you can see, array_2d is a 2 dimensional array with 3 rows and 4 columns, and it contains random integers from 0 to 20.
Compute variance with np.var
Now, let’s compute the variance of the values in the array.
np.var(array_2d)
OUT:
25.07638888888889
Explanation
When we use numpy.var on a 2-dimensional or multi-dimensional array, then by default, it computes the variance of all of the values. So in this case, np.var is computing the variance of all 12 integers, and the variance is 25.07638888888889.
EXAMPLE 3: Compute the variance of the columns
Now, in this example, we’ll compute the variance of the columns.
How?
To do this, we need to use the axis parameter.
Remember what I mentioned in the section explaining the axis parameter. Numpy axes are like directions along a Numpy array.
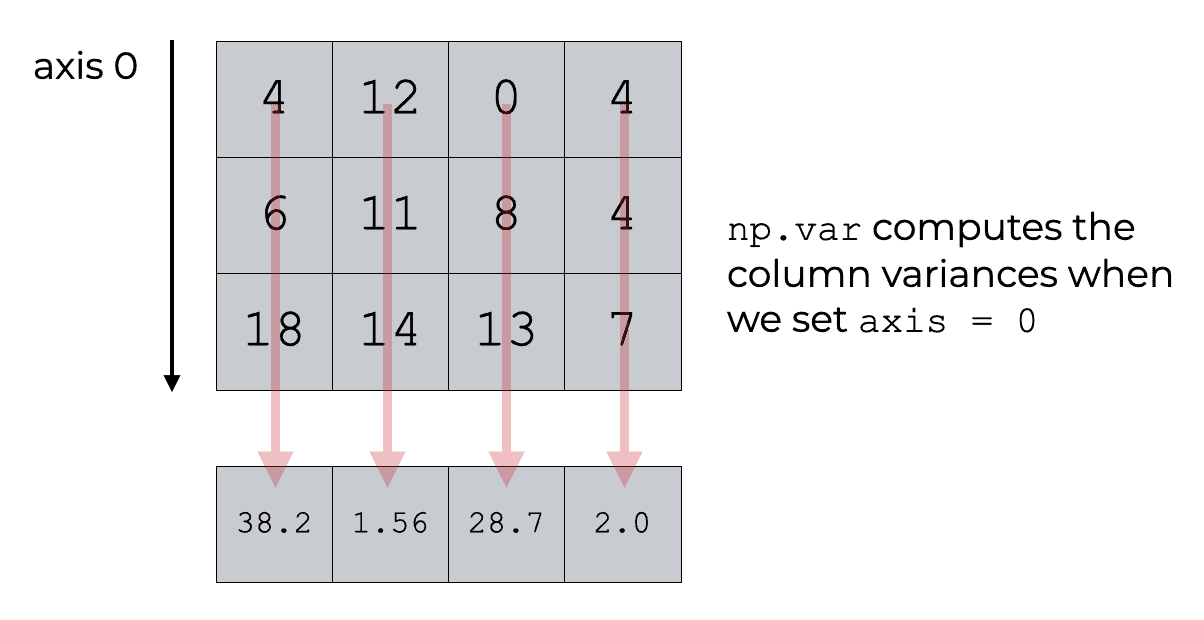
And specifically, for a 2D array, axis 0 is the axis that points downwards.
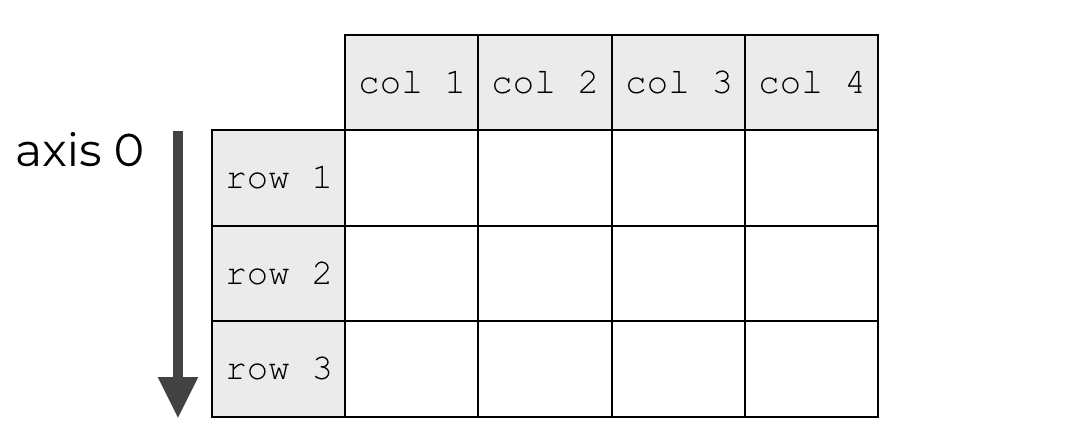
So to calculate the column variance, we need to set axis = 0.
Let’s take a look.
Create 2-dimensional array
First, we’ll create our 2D array.
(Note that this is the same array that we created in example 2, so if you already created it there, then you don’t need to re-run this code.)
np.random.seed(22)
array_2d = np.random.randint(size =(3, 4), low = 0, high = 20)
And let’s quickly print it out, so you can see the contents.
print(array_2d)
OUT:
[[ 4 12  0  4]
 [ 6 11  8  4]
 [18 14 13  7]]
Again, this is a 3 by 4 array with 12 random integers.
Use np.std to compute standard deviation of the columns
Next, we’ll use Numpy variance with axis = 0.
np.var(array_2d, axis = 0)
OUT:
array([38.22222222, 1.55555556, 28.66666667, 2.])
Explanation
Here, we computed the variance in the axis-0 direction.
Effectively, this causes Numpy var to compute the column variances.
Next, let’s compute the row variances.
EXAMPLE 4: Use np.var to compute the variances of the rows
Here, we’re going to use the np.var technique to compute the row variances. That is, we’re going to compute the variance along the axis-1 direction.
Again, remember what I said earlier: Numpy axes are like directions.
And in a 2D array, axis-1 points horizontally, like this:
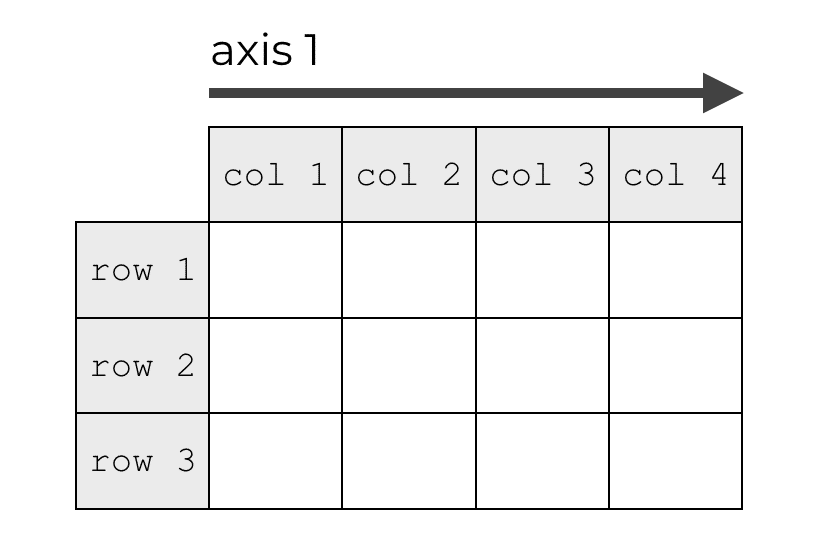
So to compute the variance in this direction, we need to set axis = 1.
Let’s take a look.
Create 2-dimensional array
Again, here we’ll quickly create a 2D array.
(This is the same array that we created in example 2, so if you already created it, you shouldn’t need to create it again.)
np.random.seed(22)
array_2d = np.random.randint(size =(3, 4), low = 0, high = 20)
And let’s print it out:
print(array_2d)
OUT:
[[ 4 12  0  4]
 [ 6 11  8  4]
 [18 14 13  7]]
Again, this is just a 2-dimensional array with 3 rows and 4 columns that contains random integers.
Use np.var to compute variances of the rows
Now that we have our array, we’ll compute the row variances.
To do this, we’ll call np.var with axis = 1.
np.var(array_2d, axis = 1)
OUT:
array([19. , 6.6875 , 15.5 ])
Explanation
This example is very similar to example 3, except here, we’re setting axis = 1.
When we use Numpy variance with axis = 1, Numpy will compute the variances in the axis-1 direction.
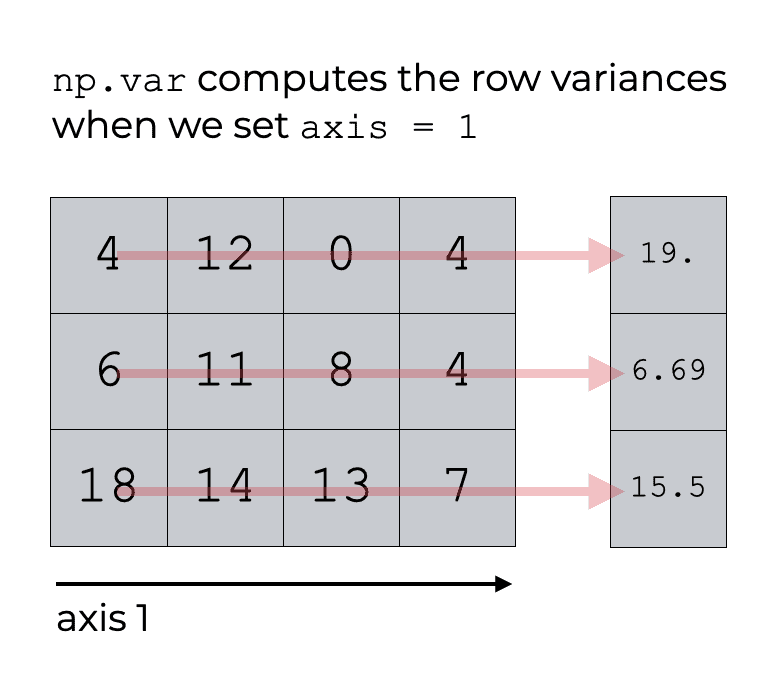
Effectively, this computes the row variances.
EXAMPLE 5: Change the degrees of freedom
In this example, we’re going to change the degrees of freedom.
Remember what I said in the section about the ddof parameter.
When we compute a population variance, we typically set the degrees of freedom to 0 (i.e., ddof = 0). This is the default behavior of Numpy variance, so if we don’t explicitly use the ddof parameter, this will happen naturally.
However, when we compute a sample variance we typically need to set the degrees of freedom to 1. To do that with Numpy variance, we need to explicitly set ddof = 1.
I’ll show you how in this example.
We’re going to first create a large array of numbers. Then we’ll take a random sample from that array, and compute the variance of that sample.
Create Numpy array
First, let’s create our “population” array.
We’ll create an array of 100 normally distributed numbers with a mean of 0 and standard deviation of 10.
np.random.seed(22)
population_array = np.random.normal(size = 100, loc = 0, scale = 10)
Create sample
Next, we’ll take a random sample of 10 items from population_array. We’re going to use Numpy random choice to randomly select the elements to put into the sample.
np.random.seed(22)
sample_array = np.random.choice(population_array, size = 10)
So now, sample_array contains a random sample of 10 elements from population_array.
Calculate the variance of the sample
Next, we’ll use Numpy variance to calculate the variance of the sample.
Again, remember what I said earlier: when we compute a sample variance, we typically need to set the degrees of freedom to 1.
So here, we’re going to call np.var with ddof = 1.
np.var(sample_array, ddof = 1)
OUT:
40.14434256384447
Explanation
Here, we’ve calculated:
![\[ var_{sample} = \frac{1}{n - ddof} \displaystyle\sum_{i = 1}^{n}(x_i - \overline{x})^2 \]](https://www.sharpsightlabs.com/wp-content/ql-cache/quicklatex.com-6a32a8790c39b9f91e1a6ed9d8323162_l3.png "Rendered by QuickLaTeX.com")
So if we set ddof = 1, the equation evaluates to:
![\[ var_{sample} = \frac{1}{n - 1} \displaystyle\sum_{i = 1}^{n}(x_i - \overline{x})^2 \]](https://www.sharpsightlabs.com/wp-content/ql-cache/quicklatex.com-bf40c9fdae68c89346bdb1e459b5c460_l3.png "Rendered by QuickLaTeX.com")
I realize that this might be a little confusing, and the reason why we do this is a little technical. To understand this better I recommend that you watch lesson from Khan Academy.
EXAMPLE 6: Use the keepdims parameter in np.var
Finally, I’ll show you how to use the keepdims parameter.
Remember that by default, the keepdims parameter is set to keepdims = False. This default behavior allows the np.var function to produce an output that has different dimensions from the input.
But here in this example, we’re going to change that and set keepdims = True.
Create 2-dimensional array
First, we’ll create a 2D array of random integers.
(This is the same array that we created in example 2, so if you already created it there, you don’t need to create it again.)
np.random.seed(22)
array_2d = np.random.randint(size =(3, 4), low = 0, high = 20)
And we can print it to look at the contents:
print(array_2d)
OUT:
[[ 4 12  0  4]
 [ 6 11  8  4]
 [18 14 13  7]]
Check the dimensions
Now that we have our array, let’s check the dimensions. This is important because the keepdims parameter operates on the dimensions of the output.
array_2d.ndim
OUT:
2
As you can see, this array, array_2d, has 2 dimensions.
Compute the variance, and check the dimensions
Next, let’s just compute the variance without using keepdims, and check the dimensions of the output.
output = np.var(array_2d)
Just for reference, let’s print the output:
print(output)
OUT:
25.07638888888889
The variance of the input array is 25.07638888888889.
Now, let’s check the dimensions of the output.
output.ndim
OUT:
0
Do you see that? The output array output has 0 dimensions. That’s because it’s just a number … a scalar value.
Why?
When we use np.var with keepdims = False, it’s essentially summarizing the numbers in the array down to a single value. In some sense, it’s taking a high-dimensional input, and summarizing it down to a single number. This operation effectively reduces the number of dimensions.
But what if we want to force the output to have 2 dimensions?
To do that, we can use the keepdims parameter.
Keep the original dimensions when we use np.var
In the following code, we’re going use np.var and set the keepdims parameter to keepdims = True.
output_2d = np.var(array_2d, keepdims = True)
And let’s print the output:
print(output_2d)
OUT:
[[25.07638889]]
Notice that the value of the output (the variance) is the same. The variance is 25.07638889.
But the value is enclosed inside of double brackets. Why?
Let’s inspect the output to take a closer look.
type(output_2d)
OUT:
numpy.ndarray
Ok. So immediately, we can see that output_2d is a Numpy array. It’s not a scalar value.
Now that we know it’s a Numpy array, let’s check the dimensions:
output_2d.ndim
OUT:
2
Notice then that output_2d is a 2-dimensional array!
So what happened here?
We called Numpy variance with keepdims = True. When we did this, we forced np.var to produce an output that had the same dimensions as the input. The input array was a 2-dimensional array, so the output was forced to have 2-dimensions. Even if the variance was a scalar value!
I’ve kept this simple for the sake of clarity, but it might not be immediately obvious why we would do this.
As an exercise, you should try running this code with keepdims = True and axis = 0 or axis = 1. You’ll see that in those cases, the output arrays will also have 2 dimensions, instead of 1 dimension.
Ultimately, if you ever need your output to have the same dimensions as the input, you can do that by setting keepdims = True.
Frequently asked questions about Numpy standard deviation
Now that you’ve learned how to use the Numpy variance function let’s look at a common question.
Frequently asked questions:
Question 1: Why isn’t np.var calculating the sample variance properly?
As I noted earlier, by default, the Numpy variance function calculates the population variance.
![\[ var = \frac{1}{N} \displaystyle\sum_{i = 1}^{N}(x_i - \overline{x})^2 \]](https://www.sharpsightlabs.com/wp-content/ql-cache/quicklatex.com-5f9ae580e9f3a53af089b8f8ece024d8_l3.png "Rendered by QuickLaTeX.com")
But to calculate the sample variance, you need to compute:
![\[ var = \frac{1}{n - 1} \displaystyle\sum_{i = 1}^{n}(x_i - \overline{x})^2 \]](https://www.sharpsightlabs.com/wp-content/ql-cache/quicklatex.com-3d063e1afd1ad1cc423261a98f08f563_l3.png "Rendered by QuickLaTeX.com")
Notice the difference in the leading fraction.
Essentially, you need to compute the variance with the leading term set to
To do this, you need to run np.var with the ddof parameter set to ddof = 1.
For a full explanation, check out example 5 in this tutorial.
Leave your other questions in the comments below
Do you have other questions about how to use the Numpy variance function?
If so, leave your questions in the comments section near the bottom of the page.
Join our course to learn more about Numpy
Are you interested in learning more about Numpy?
This tutorial should have shown you how to use the Numpy variance function, but if you want to master Numpy, there’s a lot more to learn.
If you’re ready to master Numpy you should join our premium course, Numpy Mastery.
In this course, you’ll learn everything you need to know about Numpy.
- How to create Numpy arrays
- How to use the Numpy random functions
- What Numpy axes are, and how to use them
- What the “Numpy random seed” function does
- How to reshape, split, and combine your Numpy arrays
- and much more …
Additionally, you’ll discover our unique practice system that will enable you to memorize all of the syntax that you learn. Once you take this course and practice like we show you, you’ll be able to write Numpy code fluently, accurately, and 100% from memory.
Find out more here: