In this tutorial, I’ll show you how to use the Pandas count technique to count the records in a Pandas dataframe.
I’ll explain exactly what the technique does, how the syntax works, and I’ll show you step-by-step examples so you can see Pandas count in action.
If you need something specific, just click on any of the following links.
Table of Contents:
Ok. Let’s start with a quick introduction.
A quick introduction to Pandas Count
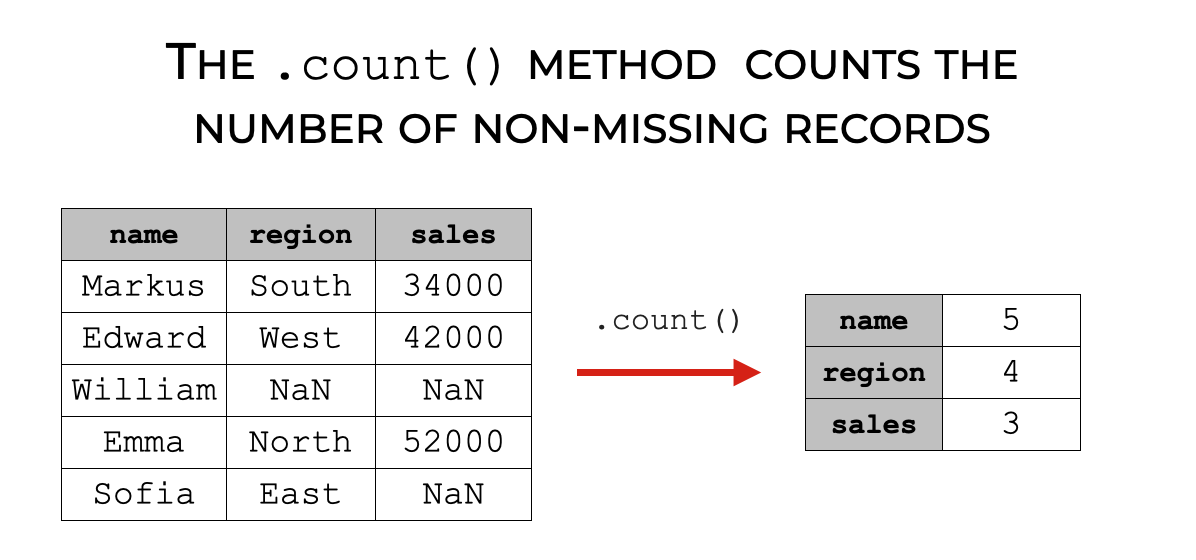
The Pandas count function is pretty simple. The count() technique counts the number of non-missing records in a Pandas object.
This method works on:
- Pandas dataframes
- Pandas Series objects
- individual dataframe columns
Frequently, we use the count() technique for data exploration.
But it’s also very useful for data cleaning and data analysis. For example, there are situations where missing values are bad, so we sometimes need to identify variables that contain non-missing values. The Pandas count technique is one way to identify columns that contain a large number of missing values.
Having said all of that, how exactly the method works depends on the syntax.
With that in mind, let’s look at the syntax of the Pandas count method.
The syntax of Pandas count
The syntax of the count method is fairly simple, but there are a few ways to use it and a few parameters that can modify its functionality.
So in this section, I’ll cover how to use the count method on dataframes and dataframe columns. I’ll also explain the most useful parameters.
A quick note
Everything that I’m about to explain assumes that you’ve imported Pandas and that you already have a dataframe that you’re working with.
You can import pandas with the following code:
import pandas as pd
And if you need a refresher on dataframes, you can read our introduction to Pandas dataframes.
Dataframe Syntax
Let’s start with how to use the count technique on dataframes.
To call the count method with a dataframe, you simply type the name of the dataframe, and then .count().
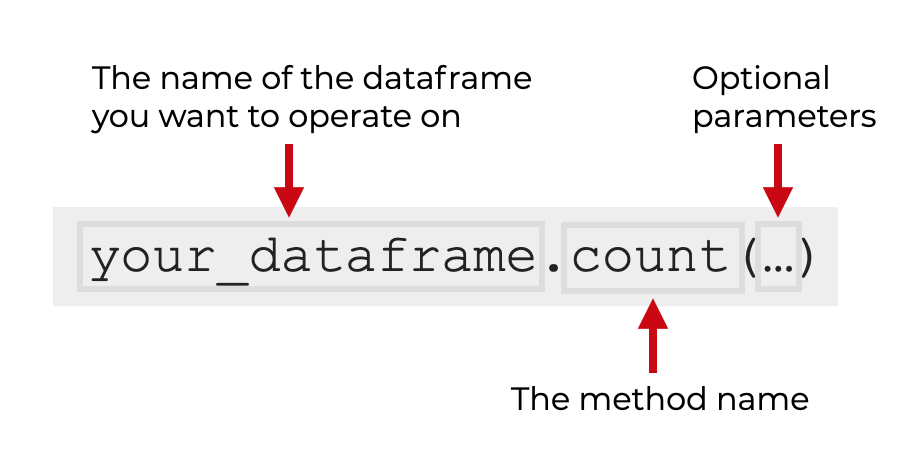
So if your dataframe is named your_dataframe, you can use the code your_dataframe.count() to count the number of non-missing values in each of the columns.
There are also some additional parameters that you can use inside the parenthesis, which we’ll get to in a moment.
Series Syntax
Next, let’s look at the syntax for how to use Pandas count on a Series.
The syntax for a Series is very similar to the syntax for a dataframe.
Simply type the name of your series, then .count() to call the method.
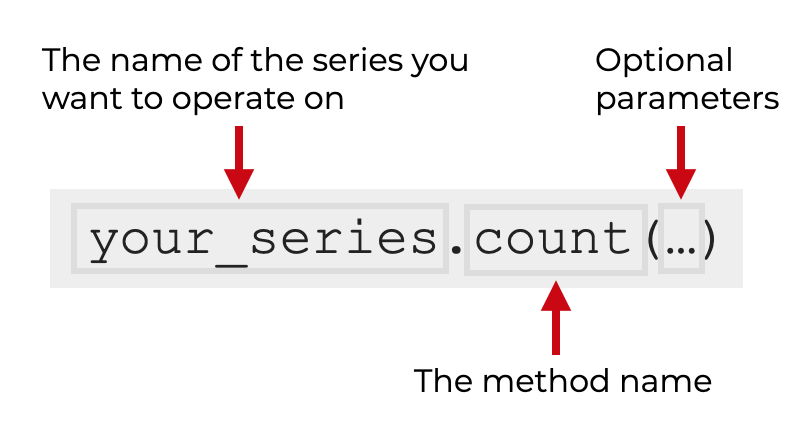
Again, there are some additional parameters that you can call that will modify the technique.
Dataframe Column Syntax
Finally, we have the syntax for a dataframe column.
Remember that a dataframe column is actually a Pandas series. Additionally, we can retrieve a column from a dataframe using so-called “dot syntax.”
So the syntax for using count() on a column is a two step process:
- retrieve the column using dot syntax
- call the count method
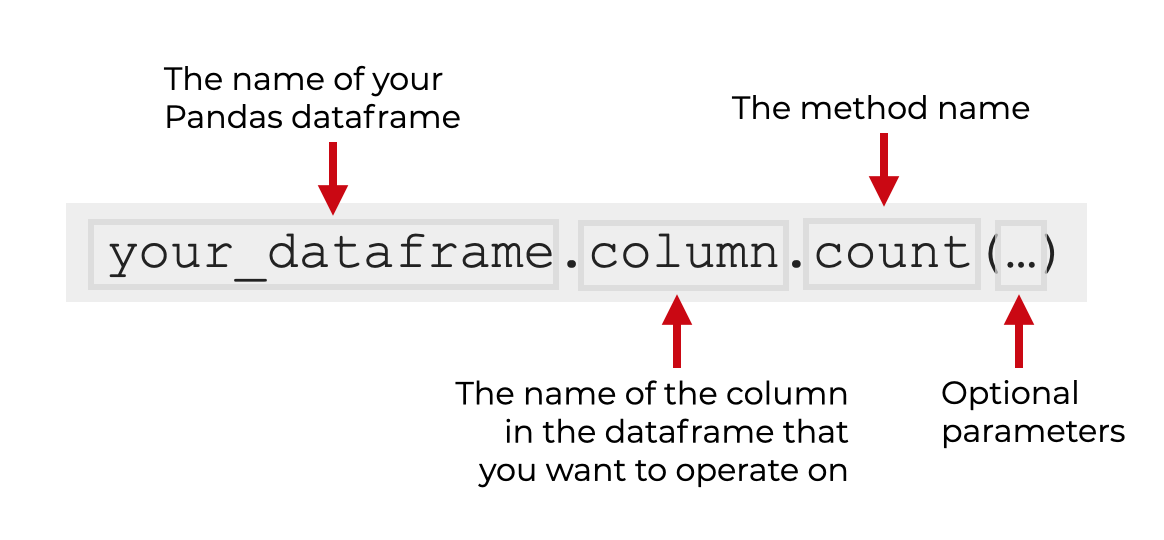
So if you have a dataframe named your_dataframe, and a column named column, you’ll use the code your_dataframe.column.count() to use the count technique on that one column.
I’ll show you an example of this in example 4.
Again though, there are some optional parameters that control how the technique works. Let’s look at those parameters.
The parameters of Pandas count
There are two parameters you should know for the count method:
axisnumeric_only
Let’s talk about each of these.
axis (optional)
The axis parameter controls whether count() operates on the rows or the columns.
By default, this parameter is set to axis = 0, so count() counts the number of non-missing values in the axis-0 direction. This is effectively the column count.
You can change this and set the parameter to axis = 1. This will compute the non-missing values in the axis-1 direction (the row counts).
You can also use an alternative notation, with axis = "columns" or axis = "rows". I strongly discourage you from using this notation, because it’s highly confusing. I explain why in the FAQ section.
One final comment on the axis parameter: to understand this parameter, you really need to understand axes. For an explanation of how axes work, you should read our tutorial on Numpy axes (Numpy axes are very similar to dataframe axes).
numeric_only (optional)
The numeric_only parameter enables you to force the count method to only return counts for numeric variables.
By default, this is set to numeric_only = False, so the count method returns the counts for all of the variables.
But if you set numeric_only = True, the count method will return the counts for the numeric variables only (integers, floats, etc).
I show an example of this in example 3.
Examples: how to count records in a Pandas dataframe or Pandas series
Now that we’ve looked at the syntax, let’s look at some examples of how to use the Pandas count technique.
We’ll look at examples of how to count the records in a dataframe, how to count the records in a single column, and a few other uses.
Examples:
- Count the records in all columns of a dataframe
- Count the number of non-missing values in the rows
- Get counts for numeric variables only
- Count the non-missing values in a specific column
- Count records in a subset of columns
Run this code first
Before you run these examples, you’ll need to run some preliminary code.
In particular, you need to:
- Import necessary packages
- Load a dataframe
Let’s do those one at a time.
Import Packages
First, let’s just import a couple packages.
We need to import Pandas (because the count() method is part of Pandas).
import pandas as pd
import seaborn as sns
We also need to import Seaborn, because we’ll be working with the titanic dataframe, which is included in the Seaborn package.
Let’s load that dataset next.
Load dataframe
Here, we’ll load the titanic dataframe.
titanic = sns.load_dataset('titanic')
Let’s also print it out, so we can see the contents:
print(titanic)
OUT:
     survived  pclass     sex   age  sibsp  parch     fare embarked   class       who  adult_male deck  embark_town alive  alone
0           0       3    male  22.0      1      0   7.2500        S   Third      man        True  NaN  Southampton    no  False
1           1       1  female  38.0      1      0  71.2833        C   First    woman       False    C    Cherbourg   yes  False
2           1       3  female  26.0      0      0   7.9250        S   Third    woman       False  NaN  Southampton   yes   True
3           1       1  female  35.0      1      0  53.1000        S   First    woman       False    C  Southampton   yes  False
4           0       3    male  35.0      0      0   8.0500        S   Third      man        True  NaN  Southampton    no   True
..        ...     ...     ...   ...    ...    ...      ...      ...     ...      ...         ...  ...          ...   ...    ...
886         0       2    male  27.0      0      0  13.0000        S  Second      man        True  NaN  Southampton    no   True
887         1       1  female  19.0      0      0  30.0000        S   First    woman       False    B  Southampton   yes   True
888         0       3  female   NaN      1      2  23.4500        S   Third    woman       False  NaN  Southampton    no  False
889         1       1    male  26.0      0      0  30.0000        C   First      man        True    C    Cherbourg   yes   True
890         0       3    male  32.0      0      0   7.7500        Q   Third      man        True  NaN   Queenstown    no   True

[891 rows x 15 columns]
This dataframe has 15 columns. If you look carefully at the output above, you’ll actually see some NaN values. We’ll be able to count the non-NaN values with count().
EXAMPLE 1: Count the records in all columns of a dataframe
First, we’ll count the number of non-null records for every column in our dataframe.
This is the simplest way to use the count method on a dataframe.
Let’s take a look, and then I’ll explain:
titanic.count()
OUT:
survived       891
pclass         891
sex            891
age            714
sibsp          891
parch          891
fare           891
embarked       889
class          891
who            891
adult_male     891
deck           203
embark_town    889
alive          891
alone          891
dtype: int64
Explanation
This is really simple.
Here, we’re using count() on the entire titanic dataframe.
To do this, we simply typed the name of the dataframe, titanic, and then .count().
In the output, we can see the number of non-missing records for every column.
We know that the dataframe has 891 total rows (we saw this when we printed out the data).
And here, we can see that many of the variables – like survived, pclass, and class – have 891 values. These variables are fully populated.
But we also see that some values have less than 891. For example, deck has only 203 non-missing records. age has 714.
This could be useful information during data cleaning. It could also be useful if you’re building a machine learning model, since some model types will not tolerate missing values.
EXAMPLE 2: Count the number of non-missing values in the rows
Next, let’s count the number of non-missing values in each of the rows.
Typically, I use the count() technique to count the non-missing values for the columns. But there might be times when you need to examine the rows instead.
To do this, we need to use the axis parameter.
Let’s take a look:
titanic.count(axis = 1)
OUT:
0      14
1      15
2      14
3      15
4      14
       ..
886    14
887    15
888    13
889    15
890    14
Length: 891, dtype: int64
Explanation
Here, we can see the number of non-missing values for the rows.
Now remember: we know from our earlier data examination that the dataframe has 15 columns. So a fully populated row should have 15 non-missing values.
But we can see that several of the rows displayed have 13 or 14 non-missing values. In fact, the first row has only 14 values. That means that some of these rows have missing values. That might be okay, but maybe not, depending on what you’re doing.
In terms of syntax, notice that we needed to set axis = 1 to count the number of missing values in the rows. Understanding Pandas “axes” is difficult, but it would definitely help if you reviewed Numpy axes. Pandas axes are essentially the same as axes for a 2D Numpy array.
Note that you can also do the same thing if you set axis = 'columns'. axis = 'columns' is the same as axis = 1. Having said that, I strongly discourage this notation, because it’s extremely confusing. Setting axis = 'columns' actually gives you the number of non-missing values for the rows. There
s a reason why the Pandas developers named it this way, but it only makes sense if you really understand what axes are. Again, I strongly suggest you avoid this alternate notation, and simply use axis = 1. I explain this more in the FAQ section.
EXAMPLE 3: Get counts for numeric variables only
Next, let’s get the counts for only the numeric variables.
To do this, we can set numeric_only = True.
titanic.count(numeric_only = True)
OUT:
survived      891
pclass        891
age           714
sibsp         891
parch         891
fare          891
adult_male    891
alone         891
dtype: int64
Explanation
Here, by setting numeric_only = True, the count() technique is computing the number of non-missing values for the numeric columns only.
EXAMPLE 4: Count the non-missing values in a specific column
Here, let’s count the non-missing values of a specific column.
In particular, we’ll count the number of non-missing values in the deck variable.
titanic.deck.count()
OUT:
203
Explanation
To get the number of non-missing values in a single column, we need to use a two step process:
- use “dot syntax” to retrieve a specific column
- call the
.count()method
So the syntax titanic.deck retrieves the deck variable from the titanic dataframe.
Then, by using .count(), Python will count the non-missing records for only that column.
EXAMPLE 5: Count records in a subset of columns
Finally, let’ me show you a “special” technique.
Here, we’ll count the non-missing records in a subset of a few columns.
To do this, we need to use some syntax that you’re unlikely to see elsewhere.
Let’s take a look, and then I’ll explain.
(titanic
 .filter(['survived','age','embark_town'])
 .count()
)
OUT:
survived       891
age            714
embark_town    889
dtype: int64
Explanation
Here, we counted the non-missing records in three variables: survived, age, and embark_town.
To do this, we actually needed to call two different Pandas methods.
First, we called the filter method, to retrieve a subset of dataframe columns.
After that, we called the count() method.
And this computes the non-missing records for only the three chosen variables in our subset.
Also, notice that all of the functions are on separate lines. To make this work, we need to enclose the whole expression inside of parenthesis.
This style of Pandas coding is atypical, but it can be very useful when you’re doing data cleaning, data exploration, or data analysis.
It’s actually a very powerful Pandas technique that you should learn more about (leave your questions about it in the comments section at the bottom of the page).
Frequently asked questions about KEYWORD
Now that you’ve seen some examples of the Pandas count technique, let’s look at a common question.
Frequently asked questions:
Question 1: Why does axis = 'columns' count the non-missing values in the rows?
If you set axis = 'columns', you’ll notice that it actually counts the non-missing values for the rows.
WTF?
Ok. To understand this, you need to understand axes, and how most people think about axes.
Let’s quickly review.
Pandas dataframes (like Numpy arrays) have axes. Axes are like directions along the dataframe.
An analogy here is the 3-dimensional Cartesian coordinate system. There’s an x-axis, y-axis, and z-axis. Those are directions in 3D space.
Dataframes also have axes. Axes are like directions along the dataframe.
For a dataframe, axis-0 points downward, and axis-1 points horizontally.
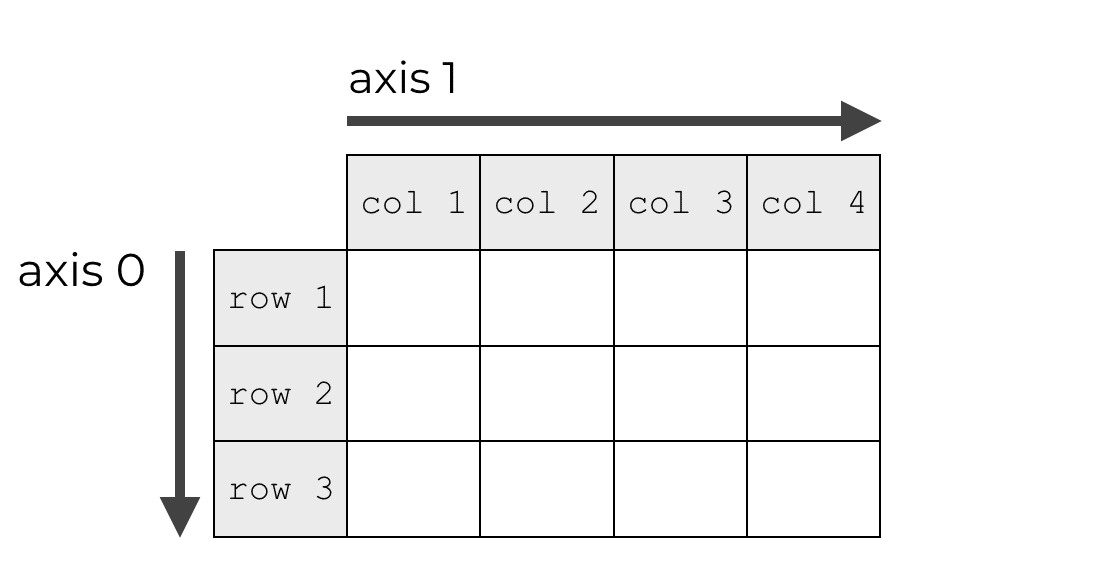
I won’t explain the reasons here about why the axes are numbered like this. It’s just something you need to memorize: axis-0 points downward, and axis-1 points horizontally.
Having said that, people commonly think of axis-1 as the “columns” axis. Why? Because when we visualize it like in the image above, we typically show an arrow pointing horizontally across the top of the columns. So people think of axis-1 as the “columns” axis.
But that’s really foolish, because when you use axis-1 for an operation, such as .count(axis = 1), it actually computes the row counts.
I honestly think this is a misunderstanding of how people think about axes, and using terminology in a counter-intuitive way.
All of that being the case, I strongly suggest that you avoid the notation count(axis = "columns") or count(axis = "rows").
Instead, use axis = 1 or axis = 0.
For more information about axes, read our tutorial on Numpy axes. The details about 2D Numpy arrays apply to Pandas dataframes.
Leave your other questions in the comments below
Do you have other questions about the Pandas count technique?
Is there something you’re still confused about, that I haven’t covered here?
If so, leave your question in the comments section below.
To learn more about Pandas, sign up for our email list
This tutorial should have helped you understand the Pandas count technique, and how it works.
But if you want to master data wrangling and data exploration with Pandas, there’s a lot more to learn.
There’s even more to learn if you want to learn data science in Python.
That said, if you’re ready to learn more about Pandas and data science in Python, then sign up for our email list.
When you sign up, you’ll get free tutorials on:
- NumPy
- Pandas
- Base Python
- Scikit learn
- Machine learning
- Deep learning
- … and more.
We publish free data science tutorials every week. When you sign up for our email list, we’ll deliver these free tutorials directly to your inbox.