In this tutorial, I’ll explain how to compute summary statistics with the Pandas describe method.
The tutorial will explain what the describe() method does, how the syntax works, and it will show you step-by-step examples.
If you need something specific, you can click on any of the following links, and it will take you to the appropriate section in the tutorial.
Table of Contents:
Ok. Let’s start with a quick description of what the Pandas describe method does.
A quick introduction to Pandas Describe
The describe() method computes and displays summary statistics for a Python dataframe. (It also operates on dataframe columns and Pandas series objects.)
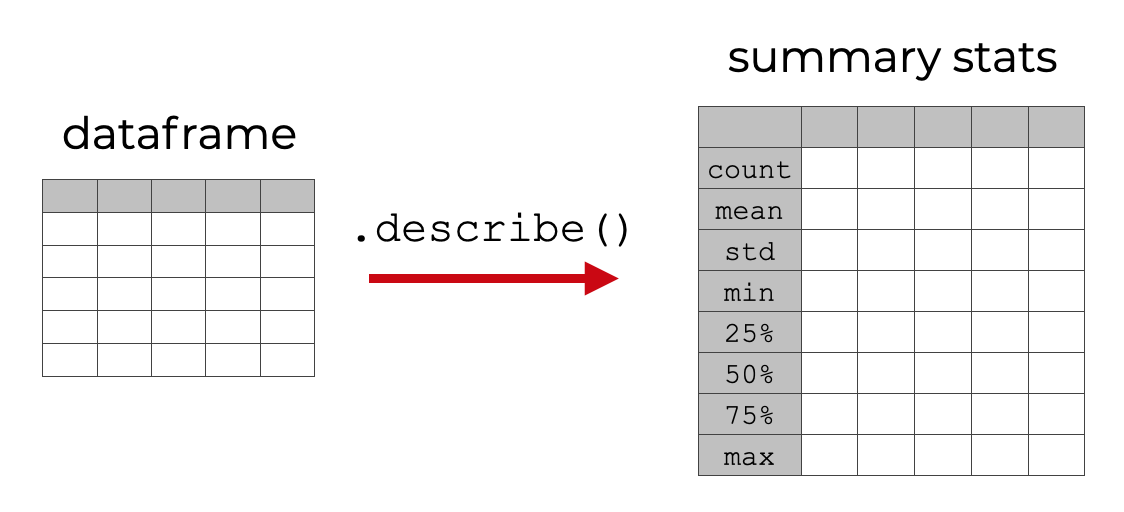
So if you have a Pandas dataframe or a Series object, you can use the describe method and it will output statistics like:
- mean
- median
- standard deviation
- minimum
- maximum
- percentiles
- etc
Having said that, the exact statistics that are computed depends on how you use the syntax.
With that in mind, let’s take a look at the syntax.
The syntax of Pandas describe
Here, we’ll take a look at the syntax of the Pandas describe method.
I’ll show you how to use the describe method on:
- dataframes
- Pandas Series objects
- dataframe columns (which are actually Series objects)
Additionally, I’ll explain some of the optional parameters that we can use to modify how the technique works.
A quick note on the convention
In the syntax explanation ahead, we’ll be assuming that we already have a Pandas dataframe or a Pandas series object.
If you need a refresher on Pandas dataframes, how they work, and how to create them, you can read our tutorial on Pandas dataframes.
pandas.dataframe.describe syntax
First, let’s look at how to use the describe method on a Pandas dataframe.
This is extremely simple.
You simply type the name of the dataframe, and then .describe().
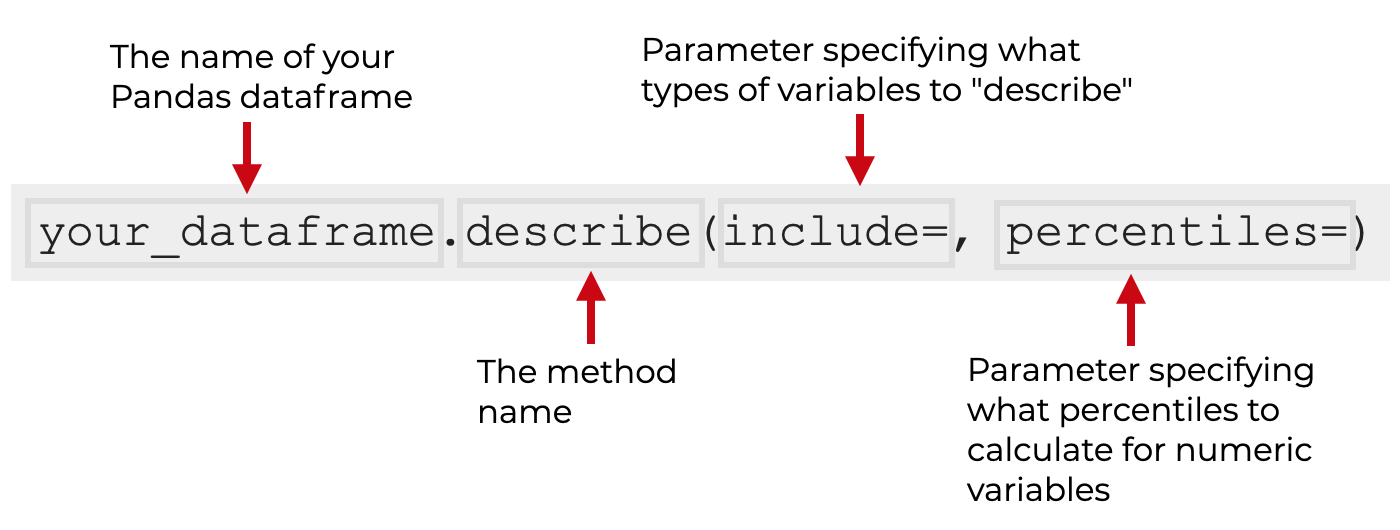
By default, if you only type your_dataframe.describe(), the describe method will compute summary statistics on all of the numeric variables in your dataframe.
There are also some optional parameters that we can use to modify the method, which we’ll get to in a moment.
pandas.series.describe syntax
You can also use the Pandas describe method on pandas Series objects instead of dataframes.
The most common use of this though is to use describe() on individual columns of a Pandas dataframe (remember, each column of a dataframe is technically a Pandas Series).
You can use the describe method on a dataframe column like this:
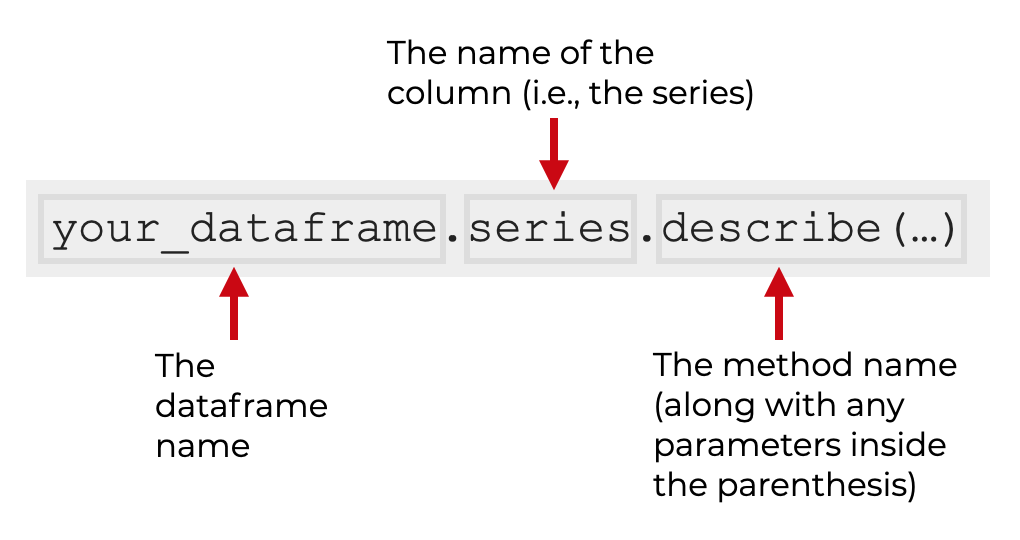
So you type the name of your dataframe, then a ‘dot’, then the name of the column, then .describe().
And once again, there are also some additional parameters that you can use inside the parenthesis. These will change the behavior of the method.
That being the case, let’s look at the additional parameters
The parameters of Pandas describe
A few of the important parameters that you can use to modify the Pandas describe method are:
includeexcludepercentilesdatetime_is_numeric
Let’s look at a few of these.
include(optional)
The include parameter enables you to specify what data types to operate on and include in the output descriptive statistics.
Possible arguments to this parameter are:
'all'(this will include all variables)numpy.number(this will include numeric variables)object(this will include string variables)'category'(this will include Pandas category variables)
Note that as shown above, some of these arguments need to be enclosed inside of quotation marks! (I’ll show you examples of these in the examples section.)
Additionally, you can provide multiple of these arguments in a Python list.
Note that this parameter is ignored when you use describe on a Series object.
exclude(optional)
The include parameter enables you to specify what data types exclude in the descriptive statistics. (Note: this is very similar to the include parameter explained above.)
Possible arguments to this parameter are:
numpy.number(this will exclude numeric variables)object(this will exclude string variables)'category'(this will exclude Pandas category variables)
Note that as shown above, some of these arguments need to be enclosed inside of quotation marks! (I’ll show you examples of these in the examples section.)
Additionally, you can provide multiple of these arguments in a Python list.
Note that this parameter is ignored when you use describe on a Series object.
percentiles(optional)
The percentiles parameter enables you to specify what percentiles to include in the descriptive statistics, when the describe() method operates on numeric variables.
By default, describe() will include the 25th and 75th percentiles.
You can provide a list or a list-like sequence of numbers between 0 and 1 as an argument to this parameter.
For example, if you set percentiles = [.1, .9], the describe method will return the 10th percentile and 90th percentiles (but will exclude the 25th and 75th percentiles).
Note that no matter what arguments you provide to the percentiles parameter, the describe method will always return the median (50th percentile).
Examples of how to use Pandas describe to calculate summary statistics
Ok. Now that we’ve looked at the syntax, let’s take a look at some examples of how to compute summary statistics with the describe() method.
Examples:
- Describe a dataframe
- Describe a single column
- Compute summary statistics for numeric variables
- Compute summary statistics for string variables
- Get summary statistics for ‘category’ variables
- Specify what percentiles to include in the output
Before you run the examples though, you need to run some preliminary code.
Import packages
First, make sure that you import Pandas, Numpy, and Seaborn.
import pandas as pd
import numpy as np
import seaborn as sns
We’ll obviously need the Pandas package for the describe method, but we’ll use Numpy when we use the include parameter. We’ll also need Seaborn to load our dataset.
Load data
Now, let’s load the dataset that we’re going to use.
In these examples, we’re going to use the titanic dataset, which is included along with the Seaborn package.
To load the titanic dataset, you can run the following code:
titanic = sns.load_dataset('titanic')
Now that we have our packages loaded and we have our dataset, we can move on to our examples.
EXAMPLE 1: Describe a dataframe
Let’s start with a simple example.
Here, we’ll use Pandas describe on an entire dataframe. By default, this will return summary statistics for all of the numeric variables.
Let’s run the code:
titanic.describe()
OUT:
         survived      pclass         age       sibsp       parch        fare
count  891.000000  891.000000  714.000000  891.000000  891.000000  891.000000
mean     0.383838    2.308642   29.699118    0.523008    0.381594   32.204208
std      0.486592    0.836071   14.526497    1.102743    0.806057   49.693429
min      0.000000    1.000000    0.420000    0.000000    0.000000    0.000000
25%      0.000000    2.000000   20.125000    0.000000    0.000000    7.910400
50%      0.000000    3.000000   28.000000    0.000000    0.000000   14.454200
75%      1.000000    3.000000   38.000000    1.000000    0.000000   31.000000
max      1.000000    3.000000   80.000000    8.000000    6.000000  512.329200
Explanation
Here, we called the describe() method using so-called “dot syntax.”
We typed the name of the dataframe, then .describe().
By default, describe computed the
- count
- mean
- standard deviation
- the minimum and maximum
- the 25th, 50th, and 75th percentiles
Note once again that by default, the method only shows statistics for the numeric variables. We’ll change that in example 3.
EXAMPLE 2: Describe a single column
Next, let’s operate on a single column of our dataframe.
Here, we’ll use “dot syntax” to retrieve a single variable first, the age variable, and then we’ll use the describe method on that column.
Let’s take a look:
titanic.age.describe()
OUT:
count    714.000000
mean      29.699118
std       14.526497
min        0.420000
25%       20.125000
50%       28.000000
75%       38.000000
max       80.000000
Name: age, dtype: float64
Explanation
When we type the code titanic.age, Python will retrieve the age variable from the dataframe.
From there, we can use dot syntax again to call the describe() method.
So here, the code titanic.age.describe() computes summary statistics only for the age variable.
EXAMPLE 3: Compute summary statistics for numeric variables
Now, let’s move back to our dataframe.
Here, we’re going to explicitly specify the variables that we’re going to include.
Specifically, we’ll indicate that we want to include only the numeric variables.
Let’s run the code, and then I’ll explain.
titanic.describe(include = [np.number])
OUT:
         survived      pclass         age       sibsp       parch        fare
count  891.000000  891.000000  714.000000  891.000000  891.000000  891.000000
mean     0.383838    2.308642   29.699118    0.523008    0.381594   32.204208
std      0.486592    0.836071   14.526497    1.102743    0.806057   49.693429
min      0.000000    1.000000    0.420000    0.000000    0.000000    0.000000
25%      0.000000    2.000000   20.125000    0.000000    0.000000    7.910400
50%      0.000000    3.000000   28.000000    0.000000    0.000000   14.454200
75%      1.000000    3.000000   38.000000    1.000000    0.000000   31.000000
max      1.000000    3.000000   80.000000    8.000000    6.000000  512.329200
Explanation
Here, notice that we called the describe method in a similar way to example 1.
But notice that inside the parenthesis, we have the syntax include = [np.number]. Remember that the include parameter enables us to specify what types of variables we want to include. Here, the syntax np.number indicates that we want to include numeric variables (i.e., Numpy numerics).
Notice as well that we’re presenting the arguments to this parameter as a list. This is very common in Pandas when you can provide multiple arguments. For example, try a list of several different data types: titanic.describe(include = [np.number, object]).
EXAMPLE 4: Compute summary statistics for string variables
Now, we’ll do an example that’s similar to example 3, but slightly different.
In example 3, we computed the summary stats for the numeric variables.
Here, we’ll compute the summary statistics for the string variables.
titanic.describe(include = [object])
OUT:
         sex embarked  who  embark_town alive
count    891      889  891          889   891
unique     2        3    3            3     2
top     male        S  man  Southampton    no
freq     577      644  537          644   549
Explanation
So what happened here?
We called the describe() method, and inside the parenthesis, we used the syntax include = [object]. Here, object refers to string variables, so the Pandas describe method computes summary stats for the string columns.
Notice that the statistics that are computed are actually different than the stats for the numeric variables.
For the numeric variables, describe() computes things like the minimum, maximum, mean, percentiles, etc.
But for these string variables, describe() has computed the count, the number of unique values, the most frequent value, and the frequency of the most frequent value.
EXAMPLE 5: Get summary statistics for ‘category’ variables
Now, let’s operate on the ‘category’ variables.
This is very similar to the previous examples.
Let’s run the code, and then I’ll explain:
titanic.describe(include = ['category'])
OUT:
        class deck
count     891  203
unique      3    7
top     Third    C
freq      491   59
Explanation
This is very similar to example 3 and example 4.
Here, we’re using the describe method to compute the summary stats for the ‘category‘ variables. We’re telling Pandas describe to do this with the code include = ['category'].
Notice that the output is similar to the output for string variables (which we saw in example 4). The output includes the count, the number of unique values, the most frequent value (i.e., the ‘top’ value), and the frequency of the most frequent value.
At this point, you might be wondering what the difference is between a string and a category.
Strings and category variables are similar, but we typically use categories when there are only a few unique values. If there are many unique values (e.g., names, sentences, unstructured text data), a string (i.e., object data) should be better.
That being said, you need to be mindful of what data types are in your dataframe.
EXAMPLE 6: Specify what percentiles to include in the output
Finally, let’s use the percentiles parameter. This enables us to specify what percentiles to include in the output, when we operate on numeric variables.
Let’s run the code, and then I’ll explain:
titanic.describe(percentiles = [.1, .9])
OUT:
         survived      pclass         age       sibsp       parch        fare
count  891.000000  891.000000  714.000000  891.000000  891.000000  891.000000
mean     0.383838    2.308642   29.699118    0.523008    0.381594   32.204208
std      0.486592    0.836071   14.526497    1.102743    0.806057   49.693429
min      0.000000    1.000000    0.420000    0.000000    0.000000    0.000000
10%      0.000000    1.000000   14.000000    0.000000    0.000000    7.550000
50%      0.000000    3.000000   28.000000    0.000000    0.000000   14.454200
90%      1.000000    3.000000   50.000000    1.000000    2.000000   77.958300
max      1.000000    3.000000   80.000000    8.000000    6.000000  512.329200
Explanation
So the output is very similar to the output for example 1. Remember that in example 1, we operated on the whole dataframe, but by default, describe included stats only for the numeric variables.
Here, the describe method has only included statistics for the numeric variables.
However, look at the percentiles. Instead of including the statistics for the 25th and 75th percentiles (which is the default), the method has included the stats for the 10th percentile and 90th percentile.
Why?
We explicitly forced this behavior with the percentiles parameter. Specifically, we set percentiles = [.1, .9]. This caused Pandas describe to include the stats for included the 10th percentile and 90th percentile instead of the 25th and 75th percentiles.
A few additional notes:
Notice that the median (50th percentile) is still included.
Also, notice that when we use this parameter, we need to present the percentiles as decimal numbers inside of a Python list: [.1, .9].
Leave your other questions in the comments below
Do you have other questions about the Pandas describe method?
Is there something that you think I’ve missed?
If so, just leave your questions in the comments section below.
For more Python data science tutorials, sign up for our email list
This tutorial should have helped you understand the Pandas describe method, but if you really want to master data manipulation with Pandas, there’s a lot more to learn.
And if you want to learn data science more broadly, there’s definitely more to learn, like data visualization and machine learning.
That being said, if you want to learn data science in Python, then sign up for our email list.
When you sign up, you’ll get free tutorials on:
- NumPy
- Pandas
- Base Python
- Scikit learn
- Machine learning
- Deep learning
- … and more.
We publish free tutorials every week, and when you sign up, we’ll deliver them directly to your inbox.
Thanks so much.
Can I include all variables and then exclude any of them? for example :
titanic.describe(include=”all”, exclude=[object])
I wish this could be part of the “Pandas Mastery” course
Thank you
You’re welcome.