This tutorial will show you how to use the Pandas dropna method to remove missing values from a Python DataFrame.
It will explain the syntax of dropna (including the important parameters).
The tutorial will also show you clear, step-by-step examples of the method.
If you’re looking for something specific, you can click on any of the following links, and the link will take you to the appropriate location in the tutorial.
Table of Contents:
Having said that, the full tutorial will explain everything in a careful way. So, if you’re new to Pandas, I recommend that you read the whole thing.
Ok … let’s start with a quick introduction to the dropna method.
A quick introduction to the Pandas dropna method
Before I explain the dropna method, let’s quickly review Pandas.
Dropna is a tool in the Pandas package.
Pandas is a data manipulation toolkit for the Python programming language. Pandas has a wide range of data manipulation tools that enable you to clean, modify, aggregate, and reshape data.
Specifically, Pandas is a toolkit for manipulating a data structure we call a DataFrame.
If you’re new to Pandas, you need to know that DataFrames are row-and-column data structures that (ideally) look something like this:
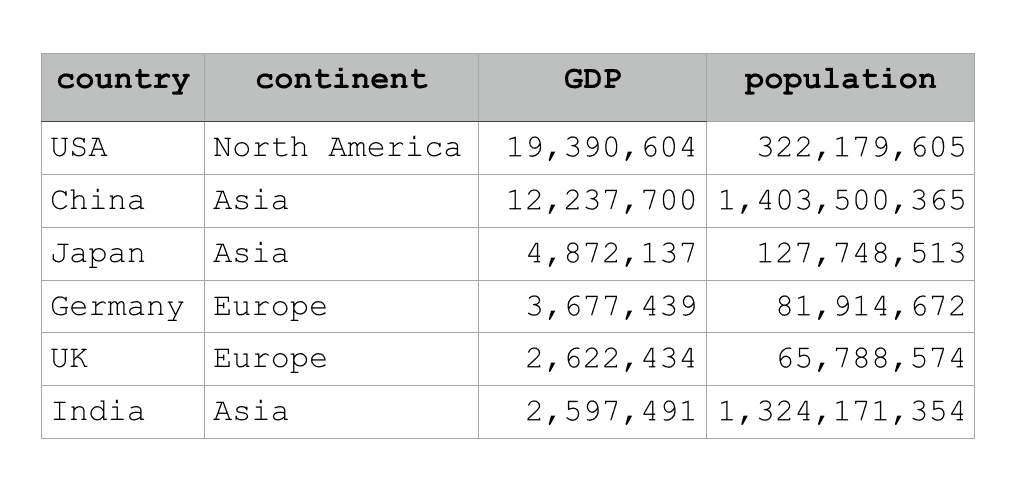
Ideally, a DataFrame has this clean row-and-column structure. But often, when we first get our data, it’s a little messy. Somtimes, the variable names need to be changed; dates and times are improperly formatted; sometimes you need to sort the data; etcetera.
One common data cleaning problem is dealing with missing values.
That’s where dropna comes in.
The Pandas dropna method drops records with missing data
Very simply, the Pandas dropna method is a tool for removing missing data from a Pandas DataFrame.
When you get a new dataset, it’s very common that some rows have missing values. That’s not always the case, but it is very common.
The question remains for the analyst, what do you do with the missing values?
There are a variety of ways to deal with missing values. One way is to fill in the missing values.
But another way to deal with missing values in a Pandas DataFrame is simply to delete them.
That’s really all the Pandas dropna method does. It removes records with missing values.
But the details of exactly how dropna works depend on the syntax.
That being the case, let’s take a look at the syntax of dropna.
The syntax of Pandas dropna
In the simplest form, the dropna method is extremely simple.
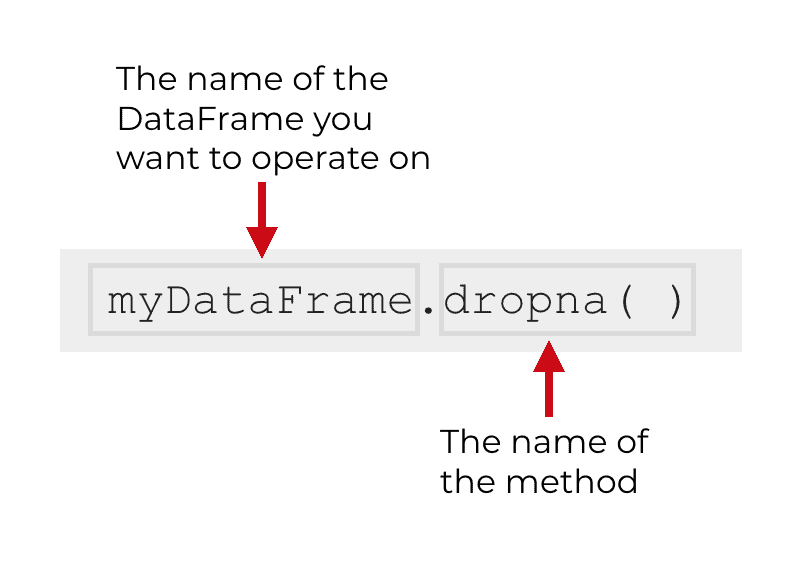
In the simplest form, you just type the name of the DataFrame, then a “.”, and then dropna().
So if you have a DataFrame called myDataFrame, the code would look like this:
When you call the method this way, dropna() will look for rows with missing values. If it finds a row with a missing value, it will drop the entire row.
Having said that, there are a few other parameters that you can use that will change the change the syntax and modify how the method operates.
Let’s take a look at the parameters of dropna.
Additional parameters of dropna
Dropna has several parameters that you can use to change the behavior of the function.
That said, I want to focus on three:
howsubsetinplace
There are other parameters – namely axis and thresh – but we’ll focus on the three listed above because they are the most common and most useful.
With these three parameters in mind, this is a more complete look at the syntax of dropna:
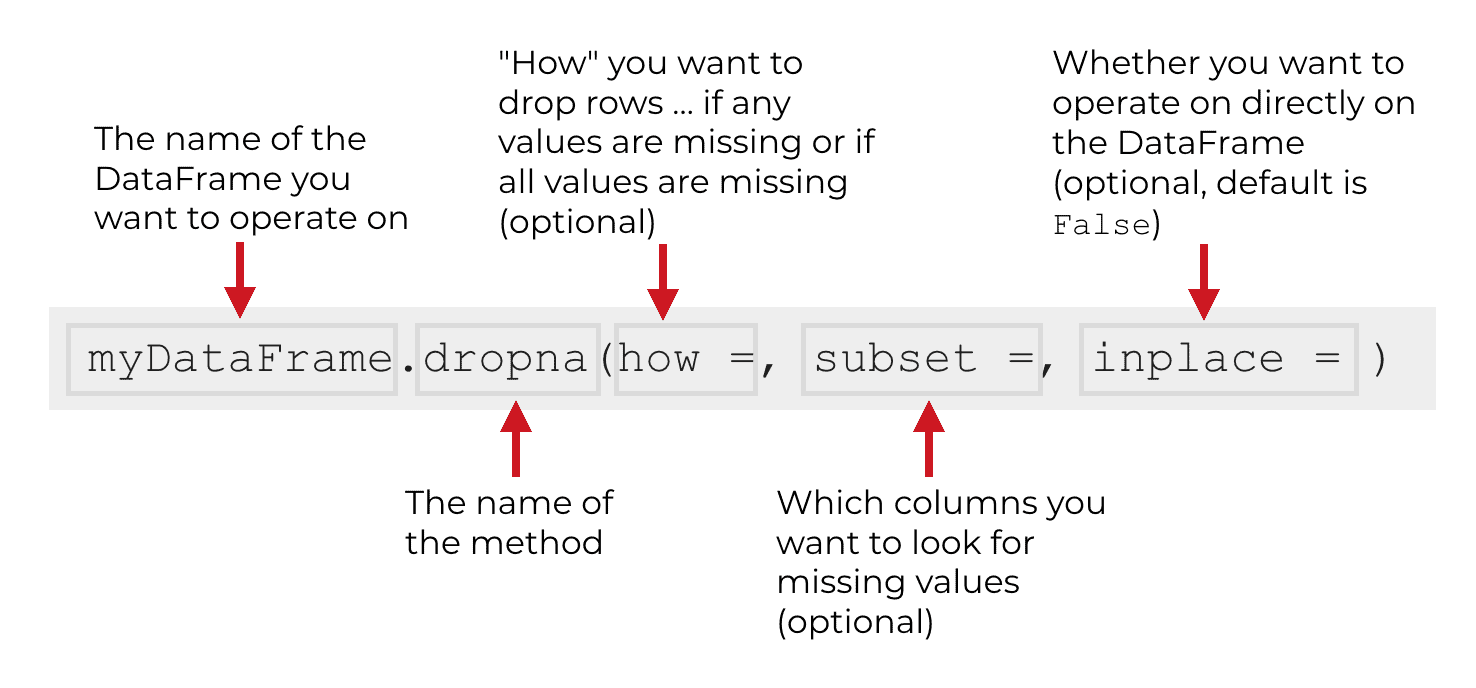
Let’s take a look at these three parameters so you understand what they do and how they work.
how (optional)
The how parameter enables you to specify “how” the method will decide to drop a row from the DataFrame.
There are two acceptable arguments to this parameter:
any: Ifhow = 'any', dropna will drop the row if any of the values in that row are missing.all: Ifhow = 'all', dropna will drop the row only if all of the values in that row are missing.
By default, the dropna method sets how = 'any', so unless you manually change this parameter, dropna will drop a row if any values are missing in that row.
subset (optional)
The subset parameter enables you to specify the subset of columns where dropna will look for missing values.
So maybe you have a dataset with 10 variables, but you only want dropna to look at 2. You can use the subset parameter to limit dropna to those two columns. I’ll show you an example of this in the examples section.
inplace (optional)
The inplace parameter enables you to specify whether you want to directly modify the DataFrame that you’re operating on.
By default, the dropna method does not directly modify the DataFrame you’re working with.
By default, dropna actually creates a new DataFrame and keeps the original DataFrame unchanged.
Syntactically, the default for the inplace parameter is inplace = False. This causes the method to leave the original DataFrame unchanged, and create a new DataFrame as an output.
However, you can change this behavior.
If you set inplace = True, the dropna method will modify your DataFrame directly. That means that if you set inplace = True, dropna will drop all missing values from your original dataset. It will overwrite your data, so be careful with it!
The output of dropna
Now that we’ve talked about the inputs and parameters for controlling dropna, let’s talk about the output of the method.
By default, dropna produces a new DataFrame as an output.
This is because by default, the syntax is set to inplace = False.
As mentioned previously though, if you set inplace = True, the dropna method will instead directly modify your original DataFrame (and won’t produce a new output).
Examples: how to use Pandas dropna to drop rows with missing data
Ok. Now that you know how the syntax works, let’s look at some examples of Pandas dropna.
Examples:
- Remove row with any missing value
- Remove row only if all values are missing
- Search for missing values only in specific columns
- Modify the dataframe “in place”
Run this code first
Before you run the examples, you’ll need to do a couple of things: import a few packages, and create a DataFrame.
Import packages
First, you need to import both the Numpy package and the Pandas package.
We need Numpy because we’re going to use a special value from Numpy, np.nan, as our missing values.
We also need Pandas in order to create our DataFrame and use the Pandas dropna method.
Here’s the code to import Numpy and Pandas:
import numpy as np
import pandas as pd
Here, we’ve imported Numpy with the alias np, and we imported Pandas with the alias pd.
Create dataframe
Next, we’re going to create a simple Pandas DataFrame.
To do this, we’ll simply use the pd.DataFrame() function and provide a dictionary of data values to the function.
sales_data = pd.DataFrame({"name":["William","Emma","Sofia","Markus","Edward","Thomas","Ethan",np.nan,"Arun","Anika","Paulo"]
,"region":[np.nan,"North","East","South","West","West","South",np.nan,"West","East","South"]
,"sales":[50000,52000,90000,np.nan,42000,72000,49000,np.nan,67000,65000,67000]
,"expenses":[42000,43000,np.nan,44000,38000,39000,42000,np.nan,39000,44000,45000]})
And we can print it using this print statement:
print(sales_data)
OUT:
       name region    sales  expenses
0   William    NaN  50000.0   42000.0
1      Emma  North  52000.0   43000.0
2     Sofia   East  90000.0       NaN
3    Markus  South      NaN   44000.0
4    Edward   West  42000.0   38000.0
5    Thomas   West  72000.0   39000.0
6     Ethan  South  49000.0   42000.0
7       NaN    NaN      NaN       NaN
8      Arun   West  67000.0   39000.0
9     Anika   East  65000.0   44000.0
10    Paulo  South  67000.0   45000.0
This DataFrame has four variables: name, region, sales, and expenses.
Notice as well that several of the rows have missing values: rows 0, 2, 3, and 7 all contain missing values. Some of the rows only contain one missing value, but in row 7, all of the values are missing.
These missing values are displayed as “NaN“. (Technically, “NaN” means “not a number”).
Now that we have our DataFrame with missing values, let’s take a look at some examples.
EXAMPLE 1: Remove row with any missing value
First, we’ll try a very simple example.
We’re going to run the dropna method without any parameters or arguments at all.
Here’s the code:
sales_data.dropna()
OUT:
       name region    sales  expenses
0   William   East  50000.0   42000.0
1      Emma  North  52000.0   43000.0
4    Edward   West  42000.0   38000.0
5    Thomas   West  72000.0   39000.0
6     Ethan  South  49000.0   42000.0
8      Arun   West  67000.0   39000.0
9     Anika   East  65000.0   44000.0
10    Paulo  South  67000.0   45000.0
Remember when we created our DataFrame, rows 0, 2, 3, and 7 all contained missing values.
Here, after using dropna(), rows 0, 2, 3, and 7 have all been removed.
That’s really all dropna does! It removes rows with missing values (it understands that NaN is a missing value).
Notice though that the code removed every row that contained any missing value. If even one of the values was missing, the whole row was deleted. That’s the default behavior. By default the how parameter is set to how = 'any', so with this code, if any of the values are missing, the whole row is removed.
Also, as mentioned previously, this code did not directly change the sales_data DataFrame. It only created a new DataFrame. I’ll show you in another example how to directly modify the original DataFrame “in place.”
EXAMPLE 2: remove row if all values are missing
Now, we’re going to modify the previous example so that dropna only removes a row if all of the values are missing.
Before we do that, let’s print out the DataFrame again:
print(sales_data)
OUT:
       name region    sales  expenses
0   William    NaN  50000.0   42000.0
1      Emma  North  52000.0   43000.0
2     Sofia   East  90000.0       NaN
3    Markus  South      NaN   44000.0
4    Edward   West  42000.0   38000.0
5    Thomas   West  72000.0   39000.0
6     Ethan  South  49000.0   42000.0
7       NaN    NaN      NaN       NaN
8      Arun   West  67000.0   39000.0
9     Anika   East  65000.0   44000.0
10    Paulo  South  67000.0   45000.0
Notice that rows 0, 2, and 3 each contain only one missing value, but all of the other values for those rows are present.
However, for row 7, all of the values are missing.
This is important for our example.
Here, we’re going to run the dropna method with the how parameter set to how = 'all'. This will remove a row only if all of the values are missing.
sales_data.dropna(how = 'all')
OUT:
       name region    sales  expenses
0   William    NaN  50000.0   42000.0
1      Emma  North  52000.0   43000.0
2     Sofia   East  90000.0       NaN
3    Markus  South      NaN   44000.0
4    Edward   West  42000.0   38000.0
5    Thomas   West  72000.0   39000.0
6     Ethan  South  49000.0   42000.0
8      Arun   West  67000.0   39000.0
9     Anika   East  65000.0   44000.0
10    Paulo  South  67000.0   45000.0
Notice that row 7 is now gone. Remember, row 7 was the row that had missing values for all of the columns.
However, rows 0, 2, and 3 are still present in the output. That’s because, even though those rows contain missing values, it’s not true that all of the values are missing. Because those rows didn’t meet the condition of “all values missing” they were kept in the output.
EXAMPLE 3: search for missing value in specific columns
Next, we’re going to limit the search for missing values to specific columns.
To do this, we’re going to use the subset parameter.
Here, we’re going to set subset = ['sales', 'expenses'].
This will limit the search for missing values to the sales variables and the expenses variable.
Let’s take a look:
sales_data.dropna(subset = ['sales', 'expenses'])
OUT:
       name region    sales  expenses
0   William    NaN  50000.0   42000.0
1      Emma  North  52000.0   43000.0
4    Edward   West  42000.0   38000.0
5    Thomas   West  72000.0   39000.0
6     Ethan  South  49000.0   42000.0
8      Arun   West  67000.0   39000.0
9     Anika   East  65000.0   44000.0
10    Paulo  South  67000.0   45000.0
Here, any row with a missing value in the sales or expenses columns has been deleted.
Notice though that row 0 has remained in the output. That is because for row 0, the missing value is in the region column. In this case, that’s okay, because the missing value wasn’t in sales or expenses. So, the dropna method kept the row in the output.
EXAMPLE 4: modify the dataframe “in place”
Finally, we’re going to modify the DataFrame “in place”.
That means that we’re going to directly delete rows from the input DataFrame.
Let’s take a look at the code, and then I’ll explain.
We’re going to do one thing first, just for the safety of our original data.
I’m going to create a copy of sales_data. Just in case you want to keep playing with the original sales_data DataFrame, we’ll copy it an use the copy in this example.
sales_data_copy = sales_data.copy()
Ok. Now we’re going to operate “in place” on sales_data_copy.
sales_data_copy.dropna(inplace = True)
If you’re working in an IDE, notice that when you run the code, it doesn’t send any output to the console. That’s because when you use inplace = True, dropna doesn’t create a new DataFrame. It directly modifies the original DataFrame. In this case, dropna directly deleted rows from sales_data_copy.
To verify this, let’s print out sales_data_copy.
print(sales_data_copy)
OUT:
      name region    sales  expenses
1     Emma  North  52000.0   43000.0
4   Edward   West  42000.0   38000.0
5   Thomas   West  72000.0   39000.0
6    Ethan  South  49000.0   42000.0
8     Arun   West  67000.0   39000.0
9    Anika   East  65000.0   44000.0
10   Paulo  South  67000.0   45000.0
Notice that the missing values have been removed from sales_data_copy.
Just remember, when you use inplace = True, the dropna is going to delete any rows from your data with missing values. If you use this parameter, be very careful and make sure that your code is working the way you need it to!
Frequently asked questions about dropna
Now that we’ve looked at some examples, let’s look at a question that people commonly have about dropna.
Frequently asked questions:
Question 1: Why didn’t dropna drop the values?
A common question from newbies is “I ran dropna, but it didn’t drop the missing values. The DataFrame is unchanged. Why?”
Remember: by default, the dropna method does not modify the original DataFrame.
Dropna creates a new DataFrame as an output.
If you’re working in an IDE, this output will not be saved, and will instead be sent to the console.
If you want to save the output, you need to save the output (typically with a new variable name) like this:
sales_data_noNA = sales_data.dropna()
In this case, the new DataFrame sales_data_noNA will be the new DataFrame without missing values, and sales_data will remain unchanged.
Alternatively, you could also use the inplace parameter and set inplace = True to directly modify the original DataFrame.
sales_data.dropna(inplace = True)
I showed you how to do this in example 4.
Just be careful … if you use inplace = True, dropna will overwrite your original DataFrame. Make sure that your code works exactly how you need it to, otherwise you might delete some of your data!
Leave your other questions in the comments below
Do you have other questions?
If so, leave your question in the comments section below.
Join our course to learn more about Pandas
If you’re serious about learning Pandas, you should enroll in our premium Pandas course called Pandas Mastery.
Pandas Mastery will teach you everything you need to know about Pandas, including:
- How to subset your Python data
- Data aggregation with Pandas
- How to reshape your data
- and more …
Moreover, it will help you completely master the syntax within a few weeks. You’ll discover how to become “fluent” in writing Pandas code to manipulate your data.
Find out more here:
import pandas as pd
print(“program to determine river basin discharge-max,min,avg” )
print(“Enter File Path as filepath/filename.file xlsx”)
a=input()
data=pd.read_excel(a,comment=’#’)
data.dropna(inplace=True)
print(data)
print(“Average discharge:”,data[“Discharge (ft3/s)”].mean(),”ft3/s”)
print(“Maximum discharge:”,data[“Discharge (ft3/s)”].max(),”ft3/s”)
print(“Minimum discharge:”,data[“Discharge (ft3/s)”].min(),”ft3/s”)
I need help to run the above file as the dropna() is returning an error. What could be the reason?
I can possibly help, but you need to be a *lot* more specific.
It’s almost impossible to understand the problem with what you’ve provided. I’d need a working example that I can run and I’d need to know the exact error message.