In this tutorial, I’ll show you how to use Pandas fillna method to fill in missing data in a DataFrame.
This tutorial is intended to be fairly comprehensive, so it will give you a good introduction to the fillna method (including a quick review of Pandas).
It will explain the syntax of Pandas fillna. It will also show you clear, step-by-step examples of how to use the fillna method.
If you’re looking for something specific, you can click on any of the following links and it will take you to the appropriate section.
Table of Contents:
However, if you’re somewhat new to data manipulation with Pandas, I recommend that you read the whole tutorial. Pandas can be a little confusing for beginners, and you’ll gain a much better understanding if you read the whole tutorial.
Ok. Let’s start with a quick introduction to fillna.
A quick introduction to Pandas fillna
So what exactly does fillna do?
Very simply, the Pandas fillna method fills in missing values in Pandas dataframes.
That said, it helps to give a little context, so I’m going to quickly explain Pandas and data manipulation generally, so you understand where fillna fits in to the data science workflow.
Pandas is a data manipulation toolkit for Python
Overall, Pandas is a toolkit for doing data analysis and data science in Python.
When we do data science, we obviously need data. Pandas provides tools for importing and “cleaning” data. It provides tools for getting data into the right shape, before we actually do data analysis.
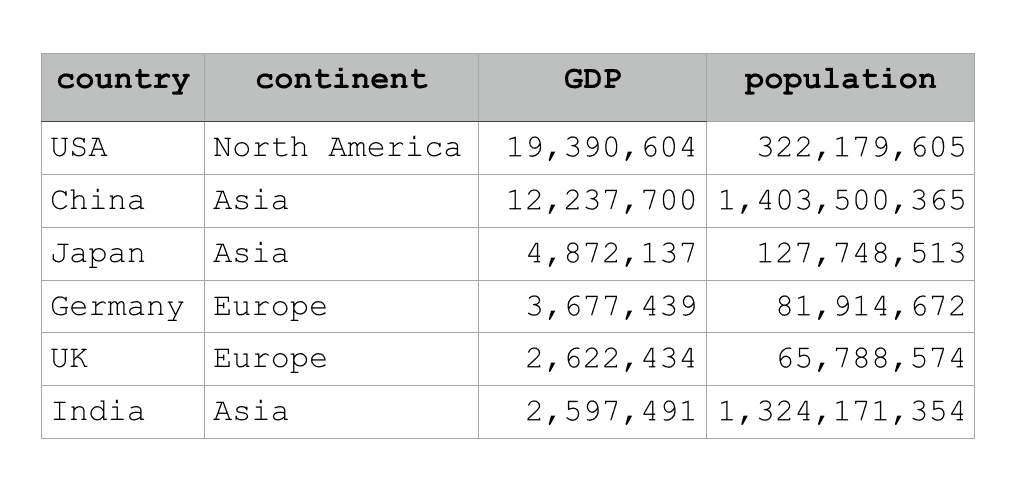
Pandas provides several ways to create a type of data structure called a DataFrame. A DataFrame is a structure that contains rows and columns, almost exactly like a spreadsheet in Microsoft Excel.
Here’s a simple example:
DataFrames are often “messy”
One common problem when we create a new DataFrame or import data into Python is messy data.
Very frequently, we need to “clean” the data up by changing variable names, recoding some values, formatting dates and times, etcetera.
One of the most common data cleaning tasks is dealing with missing values.
Frequently, when you import data from external data sources (like text files and databases), some values will be missing.
The Pandas fillna method helps us deal with those missing values.
Fillna: how to deal with missing values in Python
At a high level, the Pandas fillna method really does one thing: it replaces missing values in Pandas.
There are actually a few different ways that missing values can be coded in Python. Generally, in Python, there is the value None. Additionally, Numpy has the value np.nan which signifies a missing numeric value (nan literally means “not a number”).
Fillna: replace nan values in Python
Going forward, we’re going to work with the Pandas fillna method to replace nan values in a Pandas dataframe.
I’ll show you examples of this in the examples section, but first, let’s take a careful look at the syntax of fillna.
The syntax of Pandas fillna
Ok let’s take a look at the syntax.
At a very simple level, the syntax for fillna looks something like this:
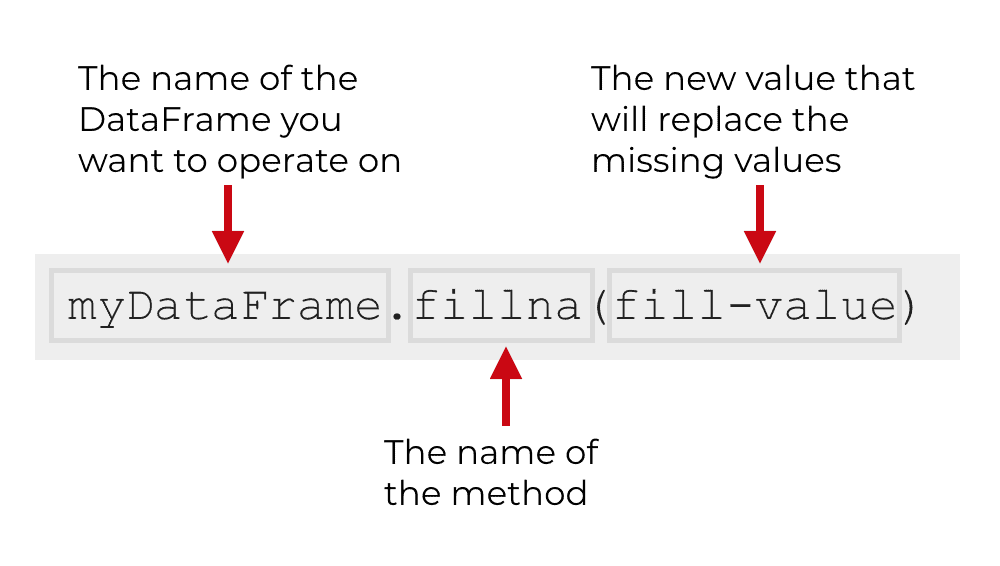
To call the method, you simply type the name of your DataFrame, then a “.”, and then fillna(). Inside of the parenthesis, you can provide a value that will be used to fill in the missing values in the DataFrame.
Having said that, there are several parameters for the Pandas fillna method that can give you more control over how the method works.
Let’s take a look at the parameters of fillna.
The parameters of Pandas fillna
The fillna method actually has 6 parameters, but some of them are rarely used.
The ones you should know about are:
valueinplace
Fillna also has parameters called method, axis, limit, and downcast. These are used somewhat infrequently for most people, so I will not explain them in this tutorial.
Let’s very quickly review the value and inplace parameters.
value
The value parameter enables you to specify the value or values that will be used to replace the missing values.
You can provide a single value, such as 0, and this will be used to fill in all of the missing values in the DataFrame.
However, you can also provide a dictionary of values (or a Pandas Series or DataFrame) to specify what missing value to use for any specific column.
I’ll show you examples of this in the examples section.
inplace
The inplace parameter enables you to modify the DataFrame directly.
By default, inplace is set to inplace = False. This means that instead of modifying the original DataFrame directly, fillna will produce a new DataFrame and leave the original DataFrame unchanged.
I need to repeat that: by default, fillna creates a new DataFrame and leaves the original DataFrame unchanged.
However, if you set inplace = True, fillna will directly modify the original DataFrame. It will fill in the missing values and directly overwrite the original DataFrame. That’s sometimes okay, but you need to be careful when you use inplace = True; you need to make sure that it works the way you need want it to.
The output of fillna
By default, the Pandas fillna method creates a new Pandas DataFrame as an output. It will create a new DataFrame where the missing values have been appropriately filled in.
However, if you set inplace = True, then the method will not produce any output at all. It will simply modify the original dataframe directly.
Ok … now that you’ve learned about the syntax, let’s take a look at some examples of fillna.
Examples: how to use fillna to replace missing values
Here, we’re going to look at some examples how to use fillna to replace missing values in a Pandas DataFrame.
We’ll start with a very simple example, and then move on to more complex examples from there, using some of the parameters of fillna.
Examples:
- How to replace nan with 0
- Use Pandas fillna on a specific column
- Use different replacement values for different variables
- Modify a dataframe “in place” with fillna
Run this code first
Before you run any of the examples, you’ll have to run some code first.
You’ll need to import some necessary packages and you’ll need to create the DataFrame that we’ll be working with.
Import packages
First, you need to import Pandas and Numpy.
import pandas as pd
import numpy as np
This is fairly straightforward. (If this doesn’t make sense, I recommend that you read about how to import Pandas packages.)
Create dataframe
Next, we’re going to create a DataFrame using the pd.DataFrame() function.
Explaining how to create DataFrames is outside of the scope of this post, so if you’re not familiar with it, you should read our explanation of how to use the Pandas DataFrame function.
In this DataFrame, we’re coding missing values as np.nan. This is a way of signifying a missing value in Python.
Here’s the code to create our DataFrame called sales_data:
sales_data = pd.DataFrame({"name":["William","Emma","Sofia","Markus","Edward","Thomas","Ethan","Olivia","Arun","Anika","Paulo"]
,"region":["East",np.nan,"East","South","West","West","South","West","West","East","South"]
,"sales":[50000,52000,90000,np.nan,42000,72000,49000,np.nan,67000,65000,67000]
,"expenses":[42000,43000,np.nan,44000,38000,39000,42000,np.nan,39000,44000,45000]})
After you run that code, you’ll have a DataFrame called sales_data.
Let’s print it out.
print(sales_data)
OUT:
       name region    sales  expenses
0   William   East  50000.0   42000.0
1      Emma    NaN  52000.0   43000.0
2     Sofia   East  90000.0       NaN
3    Markus  South      NaN   44000.0
4    Edward   West  42000.0   38000.0
5    Thomas   West  72000.0   39000.0
6     Ethan  South  49000.0   42000.0
7    Olivia   West      NaN       NaN
8      Arun   West  67000.0   39000.0
9     Anika   East  65000.0   44000.0
10    Paulo  South  67000.0   45000.0
As you can see, sales_data is a DataFrame with 11 rows and 4 columns. It contains some dummy sales data that we can use in our examples.
You’ll notice that the region, sales, and expenses variables all have at least 1 missing value. The missing values appear as “NaN“.
We’re going to fill in those missing values with fillna.
EXAMPLE 1: How to replace nan with 0 in Pandas
First, let’s just start with a very simple example.
Here, we’re going to fill in all of the missing values with the value 0.
Here’s the code:
sales_data.fillna(0)
And this is the output:
       name region    sales  expenses
0   William   East  50000.0   42000.0
1      Emma      0  52000.0   43000.0
2     Sofia   East  90000.0       0.0
3    Markus  South      0.0   44000.0
4    Edward   West  42000.0   38000.0
5    Thomas   West  72000.0   39000.0
6     Ethan  South  49000.0   42000.0
7    Olivia   West      0.0       0.0
8      Arun   West  67000.0   39000.0
9     Anika   East  65000.0   44000.0
10    Paulo  South  67000.0   45000.0
Notice that all of the missing values have been filled in with the value 0.
The missing values under sales and expenses have been filled in with 0, which seems appropriate.
However, in this simple example, the missing value in the region column has also been filled in with 0. That doesn’t seem like an appropriate value so we’ll need a way to deal with that.
As you can see, you can use fillna to fill in missing values quickly with a single value, but if you need to control how the function works with more detail, you need to use some of the other parameters.
Let’s take a look at how.
EXAMPLE 2: How to use Pandas fillna on a specific column
Now, we’re going to fill in missing values for one specific column.
To do this, we’re going to use the value parameter, and we’re going to use it in a specific way.
Here, we’re going to provide a dictionary to the value parameter. The first value in the dictionary will be the variable that we want to modify. Then the next value (the value after the colon) is the value we want to use to replace the missing values in the column in question.
Ultimately, we’re going to set the value parameter to value = {'region':'North'}. This means that fillna will look for missing values in the region variable, and replace any missing values with the value 'North'.
Here’s the exact code:
sales_data.fillna(value = {'region':'North'})
And here is the output:
       name region    sales  expenses
0   William   East  50000.0   42000.0
1      Emma  North  52000.0   43000.0
2     Sofia   East  90000.0       NaN
3    Markus  South      NaN   44000.0
4    Edward   West  42000.0   38000.0
5    Thomas   West  72000.0   39000.0
6     Ethan  South  49000.0   42000.0
7    Olivia   West      NaN       NaN
8      Arun   West  67000.0   39000.0
9     Anika   East  65000.0   44000.0
10    Paulo  South  67000.0   45000.0
Take a look at row 2 … the row for ‘Emma‘.
When we originally created our DataFrame, the region value for Emma was set to NaN. The region for Emma was missing in the sales_data DataFrame.
However, the code sales_data.fillna(value = {'region':'North'}) has replaced that missing value with the value 'North'. The code looked only in the region column and replaced the missing values in that column with the value 'North'.
Notice as well that in this case, fillna left the sales and expense variables unchanged.
The way that we set up the syntax, that’s exactly the way the method should have worked. We set it up to only operate on region.
Now, let’s look at how to modify different variables with different replacement values.
EXAMPLE 3: Use different replacement values for different variables
Here, we’re going to slightly modify the previous example and use different replacement values for different variables.
To do this, we’re going to use the values parameter again.
However, instead of providing one “key value pair” to the dictionary, we’re going to provide several.
Let me show you the code and then I’ll explain.
Here’s the syntax:
sales_data.fillna(value = {'region':'North'
                           ,'sales':0
                           ,'expenses':0
                           })
And here is the output:
       name region    sales  expenses
0   William   East  50000.0   42000.0
1      Emma  North  52000.0   43000.0
2     Sofia   East  90000.0       0.0
3    Markus  South      0.0   44000.0
4    Edward   West  42000.0   38000.0
5    Thomas   West  72000.0   39000.0
6     Ethan  South  49000.0   42000.0
7    Olivia   West      0.0       0.0
8      Arun   West  67000.0   39000.0
9     Anika   East  65000.0   44000.0
10    Paulo  South  67000.0   45000.0
Notice that the missing value under region in row 1 has been replaced with 'North'.
However, the missing values under sales and expenses have been replaced with 0.
We did this by setting the value parameter of fillna to value = {'region':'North','sales':0,'expenses':0}.
Here, we’ve provided a dictionary of key/value pairs to the value parameter. Each key/value pair specifies the variable name on the left hand side of the colon (e.g., 'region') and the new replacement value for that column on the left side of the colon (e.g., 'North').
Using this technique with the value parameter, we can specify different replacement values for different columns of a Pandas DataFrame.
EXAMPLE 4: replace missing values with the mean value
In this example, we’re going to use the same technique as the two previous examples. We’re going to use the value parameter to specify a specific replacement value.
However, here, we’re going to specify the mean.
This will be a two-step process.
First, we will calculate the mean of the variable in question. Here, we’re going to calculate the mean of the expenses variable.
expense_mean = sales_data.expenses.mean()
We’ve stored the mean of expenses as the value expense_mean. The value is roughly 41777.78
Now, we’re going to use the value parameter to replace all of the missing values in the expenses column with the value expense_mean.
sales_data.fillna(value = {'expenses':expense_mean})
OUT:
       name region    sales      expenses
0   William   East  50000.0  42000.000000
1      Emma    NaN  52000.0  43000.000000
2     Sofia   East  90000.0  41777.777778
3    Markus  South      NaN  44000.000000
4    Edward   West  42000.0  38000.000000
5    Thomas   West  72000.0  39000.000000
6     Ethan  South  49000.0  42000.000000
7    Olivia   West      NaN  41777.777778
8      Arun   West  67000.0  39000.000000
9     Anika   East  65000.0  44000.000000
10    Paulo  South  67000.0  45000.000000
Notice that the values in the expenses column have been been replaced with 41777.777778. This is the mean that we calculated earlier.
We’ve effectively replaced the missing values of expenses with the mean value.
EXAMPLE 5: Modify a dataframe “in place” with fillna
Finally, let’s modify a DataFrame “in place”.
You should have noticed that the code in the previous examples did not directly modify the sales_data DataFrame. The DataFrame should still contain missing values.
In all of the previous examples, the code produced a new DataFrame where the missing values were replaced.
That is because by default, fillna creates a new DataFrame. It does not change the original DataFrame.
In this example, we’re going to change that.
Here, we’re actually going to modify a DataFrame directly.
Just for safety though, we’re first going to create a copy of sales_data.
sales_data_copy = sales_data.copy()
We’re doing this because we’re going to overwrite our data directly. Just to make sure that we still have our original dataset intact, we’ll work with sales_data_copy instead.
Ok. Here, we’re going to use the inplace parameter and set inplace = True.
This will cause fillna to directly overwrite sales_data_copy.
Let’s run the code:
sales_data_copy.fillna(value = 0, inplace = True)
And now let’s print out sales_data_copy.
print(sales_data_copy)
OUT:
       name region    sales  expenses
0   William   East  50000.0   42000.0
1      Emma      0  52000.0   43000.0
2     Sofia   East  90000.0       0.0
3    Markus  South      0.0   44000.0
4    Edward   West  42000.0   38000.0
5    Thomas   West  72000.0   39000.0
6     Ethan  South  49000.0   42000.0
7    Olivia   West      0.0       0.0
8      Arun   West  67000.0   39000.0
9     Anika   East  65000.0   44000.0
10    Paulo  South  67000.0   45000.0
For simplicity, we just replaced the missing values with 0.
Notice though that here, the sales_data_copy has been permanently changed.
EXAMPLE 5: putting the pieces together
Let’s do one more example.
Here, we’re going to
First, we’ll create a copy of sales_data so that sales_data_copy has missing values again.
sales_data_copy = sales_data.copy()
Next, we’ll calculate the median values of both the sales variable and the expenses variable.
sales_median = sales_data_copy.sales.median()
expense_median = sales_data_copy.expenses.median()
Finally, we’ll fill in the missing values. Here, we’re going to fill in the missing values of region with the value 'North'. Then we’ll fill in the missing values of sales and expenses with the median values of those variables (which we just calculated).
Notice as well that we’re modifying the DataFrame directly by using inplace = True.
sales_data_copy.fillna(value = {'region':'North'
                                ,'sales':sales_median
                                ,'expenses':expense_median}
                                ,inplace = True
                       )
And let’s print the output:
print(sales_data_copy)
OUT:
       name region    sales  expenses
0   William   East  50000.0   42000.0
1      Emma  North  52000.0   43000.0
2     Sofia   East  90000.0   42000.0
3    Markus  South  65000.0   44000.0
4    Edward   West  42000.0   38000.0
5    Thomas   West  72000.0   39000.0
6     Ethan  South  49000.0   42000.0
7    Olivia   West  65000.0   42000.0
8      Arun   West  67000.0   39000.0
9     Anika   East  65000.0   44000.0
10    Paulo  South  67000.0   45000.0
Notice that the missing value for region row 1 has been replaced with ‘North‘, and the missing values under sales and expenses have been replaced with the median values.
Leave your other questions in the comments below
Do you have questions about fillna?
Leave your questions in the comments section below.
Join our course to learn more about Pandas
If you’re serious about learning Pandas, you should enroll in our premium Pandas course called Pandas Mastery.
Pandas Mastery will teach you everything you need to know about Pandas, including:
- How to subset your Python data
- Data aggregation with Pandas
- How to reshape your data
- and more …
Moreover, it will help you completely master the syntax within a few weeks. You’ll discover how to become “fluent” in writing Pandas code to manipulate your data.
Find out more here:
For the part where you filled the sales and expenses columns with 0 using a dictionary, I am trying to imagine a situation where there many more columns like sales and expenses that should be filled with 0 too. In that case, is there a short code for filling that many columns with 0 in the same code where region is filled with North
You could do this with a function of some type.
You could define a function that examines the variable name, and then conditionally assigns different values depending on the variable name.
That’s a little more complicated to do.
You’d probably have to define a separate function, define some variable-name/fill-value mappings, possibly use some if/else logic, and possibly use the
apply()method to apply the logic to all of the variables in the dataframe.The exact implementation would depend on the circumstances, so difficult to get into specifics.
I note that for values, you can also provide a pandas dataframe. When and how will that be used?
Thank you for the crystal-clear explanation. Thank you for giving examples that ACTUALLY make sense. Thank you for the easy-to-read formatting that makes it painless to ‘get’ the code. I know, that scientists have debunked the myth of ‘visual learners’ but that’s how I describe my style of learning and your website is an absolute godsend!! Thank you all over again!!!! Incidentally I come from R (that I love) and Python has been a total pain to learn!!
You’re very welcome.
I think that crystal-clear explanations and formatting are really important for a reader.
Also, if you’re coming from R, you might want to read these posts about Pandas and Seaborn Objects:
https://www.sharpsightlabs.com/blog/python-pandas/
https://www.sharpsightlabs.com/blog/seaborn-objects-introduction/
The Pandas post shows how to use Pandas functions in a way that’s similar to Dplyr pipes.
And the new Seaborn Objects package is very similar to ggplot2 in terms of how it works.
I originally used R too, and kind of hated Python data science tools when I started.
If you use the right packages, the right way, it’s actually pretty good.