This tutorial will show you how to use the Pandas filter method to select columns from a Pandas DataFrame.
The tutorial will explain what filter() is at a high level.
After the overview, I’ll explain the syntax of the filter method and how it works.
Later in the tutorial, I’ll show you step-by-step examples of how to select columns from a DataFrame using filter.
If you’re looking for something specific, you can click on any of these links and it will take you to the appropriate section in the tutorial.
Table of Contents:
- Introduction to Pandas Filter
- The syntax of Pandas filter
- Pandas filter examples (how to select columns)
- Frequently asked questions about Pandas filter
However, if you have a few minutes, I strongly recommend that you read the whole tutorial. The filter method is a little confusing for some people, so you really should read carefully to make sure you’re using it properly.
Ok, let’s get into it.
A quick introduction to the Pandas Filter method
Ok, first things first.
I need to clear up some confusion about what the filter method does and does not do.
The filter method does not filter rows
First: the filter method does not “filter” the rows of a DataFrame (at least not how you think).
Although the filter method can be used to subset rows based on the index values in the DataFrame, the filter method can not filter the rows based on the contents of the DataFrame. You can’t use filter to conditionally subset on the contents.
If you want to write logical conditions to filter your data based on the contents of the DataFame (i.e., the values in the cells of the DataFrame), there is a different Pandas method for that. You can use the Pandas query method to filter rows.
This is a source of some confusion. Typically, when we talk about subsetting the rows of a DataFrame, it’s common to talk about “filtering” rows of data based on conditions. For example, if you have a DataFrame with sales data, you might want to retrieve rows where the sales variable is greater than some value.
Unfortunately, that’s just not what the filter method does. It’s unfortunate because the name of the method often confuses people.
Again, if you want to filter the rows of your data, you should probably use the Pandas query method. You might also try using the loc method or the iloc method to subset your rows.
The filter method selects columns
The Pandas filter method is best used to select columns from a DataFrame.
Filter can select single columns or select multiple columns (I’ll show you how in the examples section).
Again, filter can be used for a very specific type of row filtering, but I really don’t recommend using it for that. I really recommend using the Pandas filter method for selecting variables from a DataFrame.
So if you want to know how to select columns in Pandas, this is the right tutorial.
Having said that, let’s take a look at the syntax of the filter method, so you can understand how it works.
The syntax of Pandas Filter
Let’s take a look at the syntax.
First of all, the filter method is one of the methods of the Pandas package for Python.
As such, you’ll need to install Pandas on your computer and you’ll need to import it using the code import pandas or import pandas as pd.
To call the method, you’ll also need a Pandas DataFrame. There are several ways to create Pandas DataFrames – including the pd.DataFrame() function and the pd.read_csv() function. If you don’t know how to create DataFrames, I recommend that you read this quick tutorial about Pandas DataFrames.
Pandas filter syntax explanation
Ok. Structurally, here is what the syntax looks like for the filter method.
Like all Python methods, when we call the filter method, we actually do so by using “dot notation”.
Essentially, we’ll type the name of the DataFrame that we want to modify, then a dot, then filter().
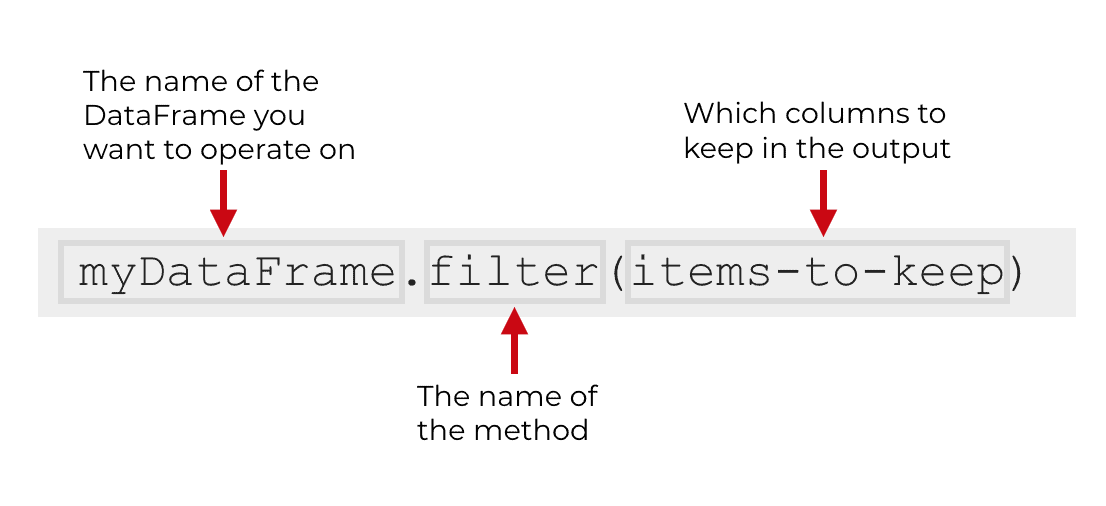
Inside of the parenthesis, you need to provide a list of columns that you want to keep.
This can be a single column name, but also a list of several columns. I’ll show you examples of both in the examples section of the tutorial.
The parameters of Pandas filter
Additionally, there are a few other parameters for the filter method that enable you to control the behavior of the method.
- like
- regex
- axis
I’ll only explain these briefly, because we won’t use them much in the tutorial.
You can use the regex parameter to define a regular expression that can be used to retrieve columns (I’ll show you an example of this later).
like can be used to identify columns that contain a particular substring.
The axis parameter is something we’re not really going to use, but I will mention it briefly in the FAQ section.
Examples: how to select columns from a Pandas dataframe
Ok. Now, let’s take a look at some examples of how to use the Pandas filter method to select columns from a DataFrame.
Examples:
- Select a single variable from a dataframe
- Retrieve multiple columns from a Pandas DataFrame
- Retrieve columns by regular expression
Run this code first
Before we actually work with the following code in these examples, we’ll need to do a few things.
Import Pandas
First, we need to import Pandas. We can import Pandas with the following code:
import pandas as pd
Notice that we’ve imported Pandas with the alias “pd“. This is a very common convention. Having said that, we can also import pandas with the code “import pandas“.
Create Data Frame
Next, we’ll create a simple DataFrame.
Here, we’re going to create a simple DataFrame of dummy sales data with four columns: name, region, sales, and expenses.
We’re doing this by using the pd.DataFrame function.
sales_data = pd.DataFrame({"name":["William","Emma","Sofia","Markus","Edward","Thomas","Ethan","Olivia","Arun","Anika","Paulo"]
,"region":["East","North","East","South","West","West","South","West","West","East","South"]
,"sales":[50000,52000,90000,34000,42000,72000,49000,55000,67000,65000,67000]
,"expenses":[42000,43000,50000,44000,38000,39000,42000,60000,39000,44000,45000]})
Let’s quickly print it out so we can take a look.
print(sales_data)
OUT:
       name region  sales  expenses
0   William   East  50000     42000
1      Emma  North  52000     43000
2     Sofia   East  90000     50000
3    Markus  South  34000     44000
4    Edward   West  42000     38000
5    Thomas   West  72000     39000
6     Ethan  South  49000     42000
7    Olivia   West  55000     60000
8      Arun   West  67000     39000
9     Anika   East  65000     44000
10    Paulo  South  67000     45000
This is very straightforward.
The DataFrame has four variables and 11 rows.
We’ll be able to subset our data and select specific variables using the filter method.
Let’s take a look at some examples.
EXAMPLE 1: Select a single variable from a dataframe
First, let’s start with the simplest example.
We’re going to select one variable from the DataFrame.
To do this, we’re going to first type the name of the DataFrame, sales_data.
After the name of the DataFrame, we type a “.” and then the name of the function, filter().
Then inside of the parenthesis, we provide the name of one of the column names, enclosed inside of a list.
Here is the syntax:
sales_data.filter(['name'])
And here is the output:
       name
0   William
1      Emma
2     Sofia
3    Markus
4    Edward
5    Thomas
6     Ethan
7    Olivia
8      Arun
9     Anika
10    Paulo
The output is a new DataFrame that only contains one column, the name column.
Before we move on, I want to point out that inside of the syntax, we must provide column that we want to retrieve in a list. And the name of the column itself must be provided as a string.
Ultimately, the argument that we passed to the function in this case was ['name'].
This first example was fairly simple. Let’s increase the complexity just a little.
EXAMPLE 2: retrieve multiple columns from a Pandas DataFrame
In this example, we’re going to retrieve multiple columns from the DataFrame.
The code will be very similar. We need to type the name of the DataFrame, and then call the filter method with “dot” notation.
Inside of the parenthesis, we’re still going to provide a list of the columns that we want to retrieve.
In this case though, the list will contain multiple column names.
Let’s take a look:
sales_data.filter(['name','sales'])
And here is the output:
       name  sales
0   William  50000
1      Emma  52000
2     Sofia  90000
3    Markus  34000
4    Edward  42000
5    Thomas  72000
6     Ethan  49000
7    Olivia  55000
8      Arun  67000
9     Anika  65000
10    Paulo  67000
In the syntax, we noted that we want to retrieve the name column and the sales column by passing in a list of those two columns as the argument: ['name','sales'].
Essentially, when we want to retrieve multiple columns from a DataFrame, we simply provide a list of those column names to the function in the form of a list.
In this example, we provided a list of two columns, but you can provide a list of as many as you want.
EXAMPLE 3: Retrieve columns by regular expression
Finally, we’re going to retrieve a group of columns by using a regular expression.
Explaining how regular expressions work is beyond the scope of this blog post.
However, Wikipedia defines a regular expression as “a sequence of characters that define a search pattern.”
Essentially, when we use regular expressions, we’re looking for all items that match a specific pattern. For example, you could search for all items that start with ‘n’. Or all items that contain the letter ‘e’.
In this example, we’re going to use a regular expression to search for and return all columns that end in the letter ‘s’.
To do this, we’re going to call the filter function with the code filter(regex = 's$'). Here, we’re using the regex parameter to define a regular expression. The code 's$' just means “items that end in an ‘s’ “. The dollar sign, $, in this case literally means “ends with”. Again, if this is confusing, I recommend that you learn more about regular expressions.
Ok. Let’s run the code:
sales_data.filter(regex = 's$')
And here is the output:
    sales  expenses
0   50000     42000
1   52000     43000
2   90000     50000
3   34000     44000
4   42000     38000
5   72000     39000
6   49000     42000
7   55000     60000
8   67000     39000
9   65000     44000
10  67000     45000
Take a look.
In this case, the filter method only retrieved two columns …
… the columns that end in an “s”.
Regular expressions are extremely powerful. To really unlock the full power of the filter method, I suggest that you learn more about them (we’ll probably create a tutorial about regular expressions some time in the future).
Frequently asked questions about Pandas Filter
Here are answers to a few common questions about filter.
Frequently asked questions:
Question 1: What does the ‘like’ parameter do?
The ‘like‘ parameter enables you to identify items that contain a certain string.
So let’s say that you had a DataFrame that contains multiple variables, including the variables first_name and last_name.
You could use the code like = 'name' to retrieve both variables …. the code would retrieve both first_name and last_name because they both contain the string “name”.
Question 2: Can you use filter to select rows?
Yes.
To be honest, I don’t recommend it.
The filter method can not filter rows based on the contents of the DataFrame.
So for example, let’s say that you want to subset the sales_data DataFrame and retrieve the rows where sales > 50000.
You can’t do that with the filter method.
The filter method can only filter on the index.
So for example, you could run the following code:
sales_data.filter([1], axis = 0)
Which returns the following DataFrame:
   name region  sales  expenses
1  Emma  North  52000     43000
Here, we used the axis parameter to indicate that we want to filter the rows, and we indicated that we want to retrieve the row at index 1.
Again, you can only retrieve rows this way by index value, not by conditional statements based on the internal data of the DataFrame.
Because of this, I recommend typically only using filter to retrieve the columns of the DataFrame.
If you want to subset your rows based on logical conditions, you should use the query method instead.
Leave your other questions in the comments below
Do you have more questions about the Pandas query method?
Leave your questions in the comments section below.
Join our course to learn more about Pandas
If you’re serious about learning Pandas, you should enroll in our premium Pandas course called Pandas Mastery.
Pandas Mastery will teach you everything you need to know about Pandas, including:
- How to subset your Python data
- Data aggregation with Pandas
- How to reshape your data
- and more …
Moreover, it will help you completely master the syntax within a few weeks. You’ll discover how to become “fluent” in writing Pandas code to manipulate your data.
Find out more here:
How can filter a range of columns, for example, from 1:100 using filter function
Don’t use filter for this.
You need to use the iloc function.
Read about it here: How to use Pandas iloc to subset Python data
Hi 🧡
Which of the following is correct?
1- iloc stands for impilicit location.
2- iloc is index location.