In this tutorial, I’ll show you how to use the Pandas mean technique. The mean() technique calculates the mean of the the numeric values in a Pandas dataframe or Pandas series.
So in the tutorial, I’ll explain how we use the technique, how the syntax works, and I’ll show you step-by-step examples.
If you need something specific, just click on any of the following links.
Table of Contents:
Let’s start with an introduction to Pandas mean.
A quick introduction to Pandas Mean
The Pandas mean technique is a tool for data exploration and data analysis in Python.
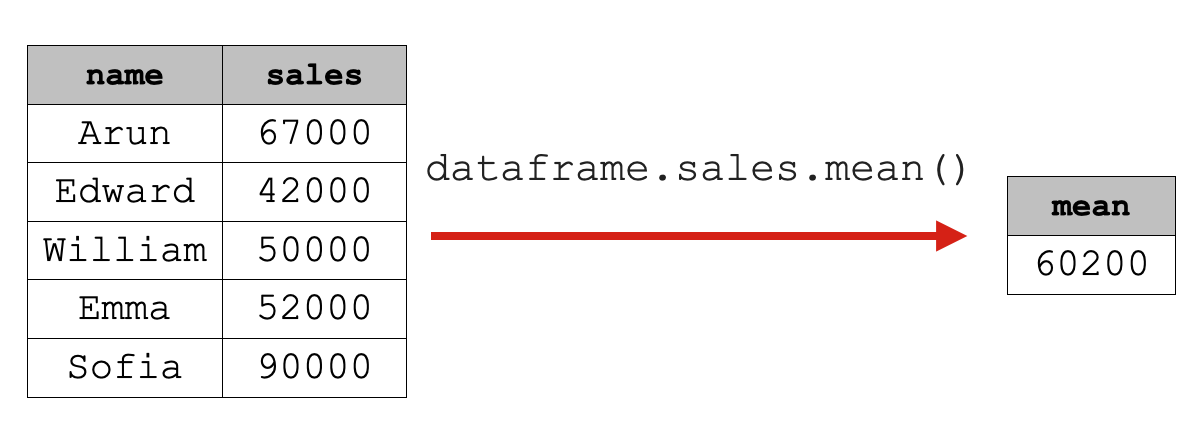
We use the mean() technique to compute the mean of the values in a Pandas dataframe or Series.
It’s most common to use this tool on a single dataframe column, but the Pandas mean technique will work on:
- entire Pandas dataframes
- Pandas Series objects
- individual dataframe columns
Again, the Pandas mean technique is most commonly used for data exploration and analysis. When we analyze data, it’s very common to examine summary statistics like mean, median, minimum, maximum, etc.
We sometimes do this for a whole variable, but there are also instances when we first group our data by a categorical variable, and then compute the mean by category. This is extremely common in data analysis, and extremely useful. I’ll show an example of a grouped mean in the examples section.
But before we look at examples of the technique, we first need to understand the syntax.
That being the case, let’s look at the syntax of the Pandas mean technique.
The syntax of Pandas mean
The syntax for the pandas mean technique depends on what type of object you’re using it on.
We can use mean() on:
- dataframes
- Series
- individual dataframe columns
That being the case, we’ll look separately at the dataframe syntax, the Series syntax, and the syntax for using mean on a single dataframe column.
A quick note
For all of the following syntax explanations, I’ll assume that you already have Pandas installed, and that you have a dataframe that you can work with.
You can import Pandas with the following code:
import pandas as pd
If you need a quick review of Pandas dataframes, please read our introduction to dataframes in Python.
Dataframe Syntax
Let’s start with the syntax for how to use mean() on a dataframe.
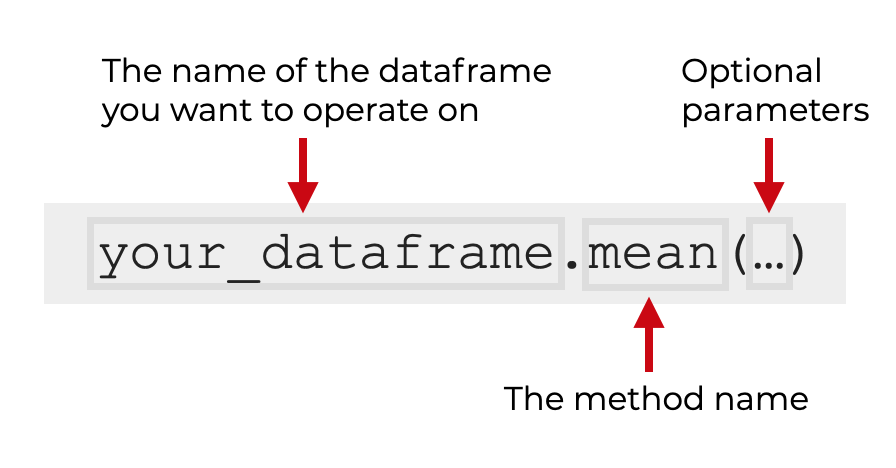
When you use mean() on an entire dataframe, you simply type the name of the dataframe and then .mean() to call the method.
When you use mean() on a whole dataframe, it will attempt to operate on all of the columns by default. In practice though, the output typically includes only the means of numeric variables (int, float, and bool).
There are also some optional parameters that you can use, which will modify the output slightly. I’ll explain those in the parameters section.
Series Syntax
You can also use the mean() technique on an independent Pandas Series.
The syntax to use the mean technique on a Series is very similar to the syntax for a dataframe.
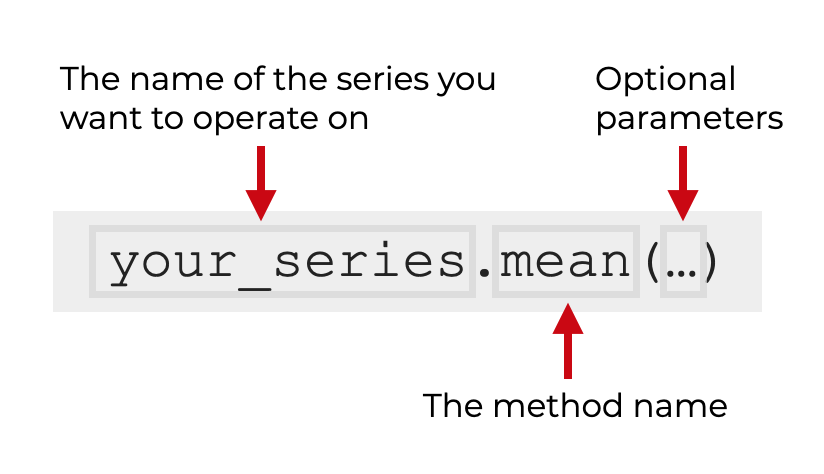
To use mean() on a Series, simply type the name of the series, and then .mean() to call the method.
Just like for dataframes, when you use mean() on a Series, there are some additional parameters that you can use to modify the output. I’ll explain those in the parameters section.
Dataframe Column Syntax
Finally, let’s look at the syntax for using mean() on a single dataframe column.
Dataframe columns are actually Pandas Series objects, so the syntax for using Pandas mean on a column is a two step process:
- retrieve the column using dot syntax
- call the
mean()method
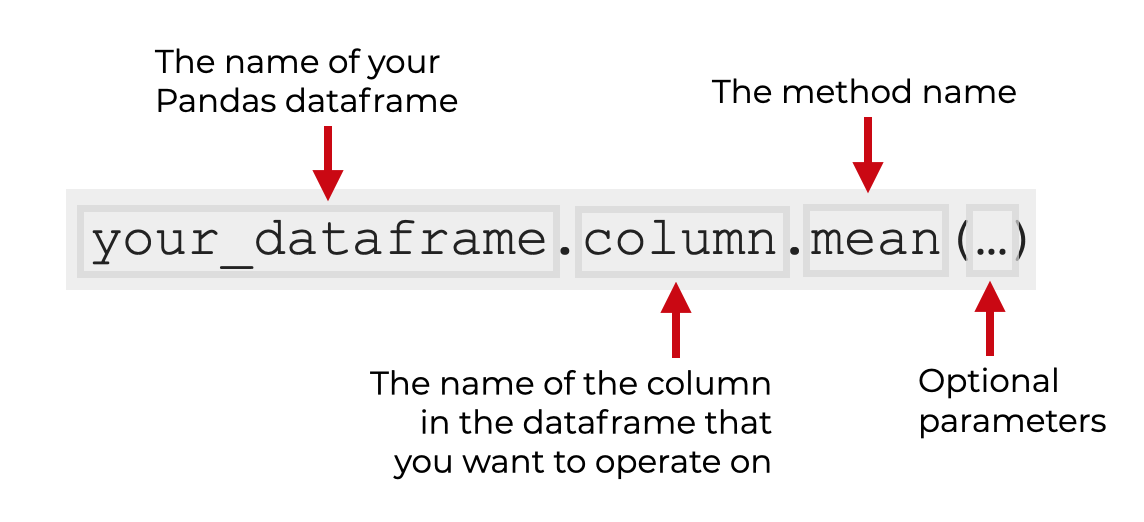
So for example, if you have a dataframe named your_dataframe, and the column you want to operate on is named column, you’ll use the code your_dataframe.column.mean(). That will compute the mean of that single column.
But again, there are some other optional parameters that you can use that will modify the output.
Let’s take a look at those parameters.
The parameters of Pandas mean
The mean technique has several parameters that you can use that will change how it operates.
Having said that, the only parameter I think you might want to use is skipna.
The other parameters, like axis, level, and numeric_only aren’t particularly useful for the mean() method.
That being the case, I’m only going to discuss skipna here.
skipna
The skipna parameter enables you to “skip” the missing values when the mean is calculated.
By default, this is set to skipna = True, which causes the mean() method to exclude missing values or NaN values.
If you set skipna = False, the method will attempt to include the missing values. Beware though: if you do this, the resulting output may be NaN itself.
I’ll show you how to use skipna in example 3.
Examples: how to calculate the mean on a Pandas dataframe or Pandas series
Now that we’ve looked at the syntax and parameters, let’s look at some examples of the Pandas mean method.
Examples:
- Calculate mean of a single dataframe column
- Use the mean method on an entire dataframe
- Include missing values
- Compute means, grouped by a categorical variable
Run this code first
Before you run the examples, you’ll need to run some preliminary code.
Specifically, you’ll need to:
- Import necessary packages
- Create a dataframe
Let’s do those.
Import Packages
First, we’ll import some packages.
import pandas as pd
import seaborn as sns
We’re importing Pandas, since the mean method is part of the Pandas package.
Additionally, we need to import Seaborn, because we’ll be working with a dataframe that’s contained in the Seaborn package.
Get the titanic dataframe
Next, let’s retrieve the titanic dataframe.
titanic = sns.load_dataset('titanic')
And let’s print it out:
print(titanic)
OUT:
     survived  pclass     sex   age  sibsp  parch     fare embarked   class       who  adult_male deck  embark_town alive  alone
0           0       3    male  22.0      1      0   7.2500        S   Third      man        True  NaN  Southampton    no  False
1           1       1  female  38.0      1      0  71.2833        C   First    woman       False    C    Cherbourg   yes  False
2           1       3  female  26.0      0      0   7.9250        S   Third    woman       False  NaN  Southampton   yes   True
3           1       1  female  35.0      1      0  53.1000        S   First    woman       False    C  Southampton   yes  False
4           0       3    male  35.0      0      0   8.0500        S   Third      man        True  NaN  Southampton    no   True
..        ...     ...     ...   ...    ...    ...      ...      ...     ...      ...         ...  ...          ...   ...    ...
886         0       2    male  27.0      0      0  13.0000        S  Second      man        True  NaN  Southampton    no   True
887         1       1  female  19.0      0      0  30.0000        S   First    woman       False    B  Southampton   yes   True
888         0       3  female   NaN      1      2  23.4500        S   Third    woman       False  NaN  Southampton    no  False
889         1       1    male  26.0      0      0  30.0000        C   First      man        True    C    Cherbourg   yes   True
890         0       3    male  32.0      0      0   7.7500        Q   Third      man        True  NaN   Queenstown    no   True

[891 rows x 15 columns]
This dataframe has quite a few numeric columns for which we’ll be able to calculate the mean.
So now that we have our data, let’s look at some examples.
EXAMPLE 1: Calculate mean of a single dataframe column
First, let’s start by calculating the mean of a single dataframe column.
Here, we’ll calculate the mean of the age variable.
titanic.age.mean()
OUT:
29.69911764705882
Explanation
This is fairly simple, but let me explain.
Here, we’re using “dot syntax” to retrieve the age variable. We’re doing that with the code titanic.age.
But directly after that, we’re using .mean() to compute the mean.
Effectively, this retrieves the age variable from the titanic dataframe, and computes the mean on only that variable.
EXAMPLE 2: Use the mean method on an entire dataframe
Next, let’s use the mean technique on a whole dataframe.
titanic.mean()
OUT:
survived       0.383838
pclass         2.308642
age           29.699118
sibsp          0.523008
parch          0.381594
fare          32.204208
adult_male     0.602694
alone          0.602694
dtype: float64
Explanation
Calling mean() on the entire dataframe caused the method to compute the mean of every numeric variable, including boolean variables.
So for example, it calculated the mean of age (a floating point number).
It calculated the mean of survived (a 0/1 integer).
And it also calculated the mean of alone, which is a bool variable. When it operates on a boolean variable, it treats True as a 1 and False as a 0, then computes the mean.
Also notice that in the case of boolean data or 0/1 integers, the mean actually represents a proportion.
So for example, the mean of survived is 0.383838. According to the data, that’s the proportion of people who survived the sinking of the Titanic!
EXAMPLE 3: Include missing values
Now, let’s include missing values.
By default, when we use mean(), the skipna parameter is set to skipna = True. This causes Pandas mean to ignore missing values.
We can turn that off by setting skipna = False.
titanic.mean(skipna = False)
OUT:
survived       0.383838
pclass         2.308642
age                 NaN
sibsp          0.523008
parch          0.381594
fare          32.204208
adult_male     0.602694
alone          0.602694
dtype: float64
Explanation
Notice in the output that the mean() technique has successfully calculated the mean for most of the variables.
But the mean of age is now NaN.
This is because the age variable contains missing values, which have now been included in the calculation.
When a variable has missing values like this, you may want to ignore them with skipna = False. Or, you may want to fill in the missing values using the Pandas fillna technique.
EXAMPLE 4: Compute means, grouped by a categorical variable
Finally, let’s compute grouped means.
Here, we’re going to calculate the “mean” of the survived variable by class.
(titanic
 .groupby(['class'])
 .survived
 .mean()
)
OUT:
class
First     0.629630
Second    0.472826
Third     0.242363
Name: survived, dtype: float64
Explanation
Here, we calculated the mean of survived, by class.
Doing this required multiple steps:
- group the data by
classusinggroupby() - retrieve the
survivedvariable - call the
mean()method
Additionally, notice that we wrote this code on multiple separate lines. This makes the code much easier to read and debug. To do this, we enclosed the entire expression inside of parenthesis. This is an uncommon syntax style, but it’s extremely powerful for performing multi-step processing or analysis with Pandas.
In terms of output, this actually produced the survival rate by class. This shows a simple example of how we can use Pandas to do data analysis.
Pandas is of course a great toolkit for data wrangling. But if you know how to use it properly, it’s an extremely powerful toolkit for analyzing data and “finding insights” in data.
Leave your other questions in the comments below
Do you have other questions about the Pandas mean technique?
Is there something that I haven’t covered here, that you’re still confused about?
If so, leave your question in the comments section below.
To learn more about Pandas, sign up for our email list
This tutorial should have helped you understand the Pandas mean technique, and how it works.
But to master data cleaning, data exploration, and data analysis with Pandas, there’s a lot more to learn.
And if you want to be great at data science, there’s even more to learn beyond Pandas.
That said, if you’re ready to learn more about Pandas and data science in Python, then sign up for our email list.
When you sign up, you’ll get free tutorials on:
- Base Python
- Pandas
- NumPy
- Machine learning
- Deep learning
- Scikit learn
- … and more.
We publish free data science tutorials every week. When you sign up for our email list, we’ll deliver those tutorials directly to your inbox.
Hello, thanks a lot.
I have two questions:
1- When I want to calculate the mean of the whole DF, the output showed a warning (Dropping of nuisance columns in DataFrame reductions), when in the blog post is not the warning. Why?
2- After grouping by class variable, the warning no longer raise. Why?