This tutorial will show you how to use the Pandas set index method to set the index of a Pandas DataFrame.
The tutorial will explain the syntax for the set_index method. It will also show you clear, step-by-step examples of how to set an index for a Pandas DataFrame.
The tutorial is organized into sections.
If you’re trying to get information about something specific, the following links will take you to the appropriate section of the tutorial.
Table of Contents:
- Introduction to Pandas indexes
- The syntax of set_index()
- Examples: How to set a DataFrame index in Pandas
- Pandas set index FAQ
Having said that, if you don’t really know much about Pandas indexes, you should read the whole tutorial.
A quick introduction to Pandas indexes
To understand the Pandas set_index function, you really need to understand DataFrame indexes.
And to understand indexes, you need to know about DataFrames.
Quickly, let’s review Pandas DataFrames.
A quick review of Pandas DataFrames
The Pandas DataFrame is a data structure in Python that holds data.
Specifically, DataFrames hold data in a row-and-column format. They look something like this:
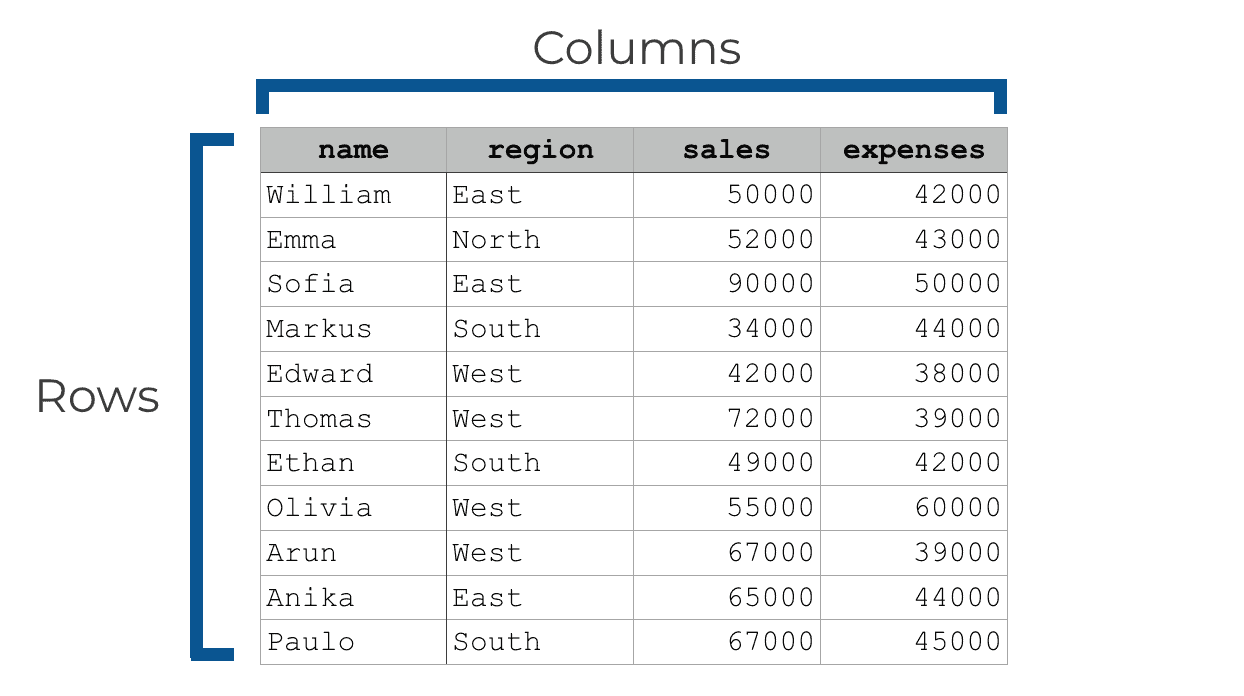
The Pandas package is essentially a toolkit for creating DataFrames, manipulating DataFrames, and retrieving data from DataFrames.
One of the critical parts of a DataFrame that we need for data manipulation and retrieval is the “index.”
Pandas dataframes have an “index”
Every DataFrame has an index. You can think of an index as a group of labels that identify the rows of a DataFrame.
By default, the “index” is the range of integers starting at 0, which looks something like this:
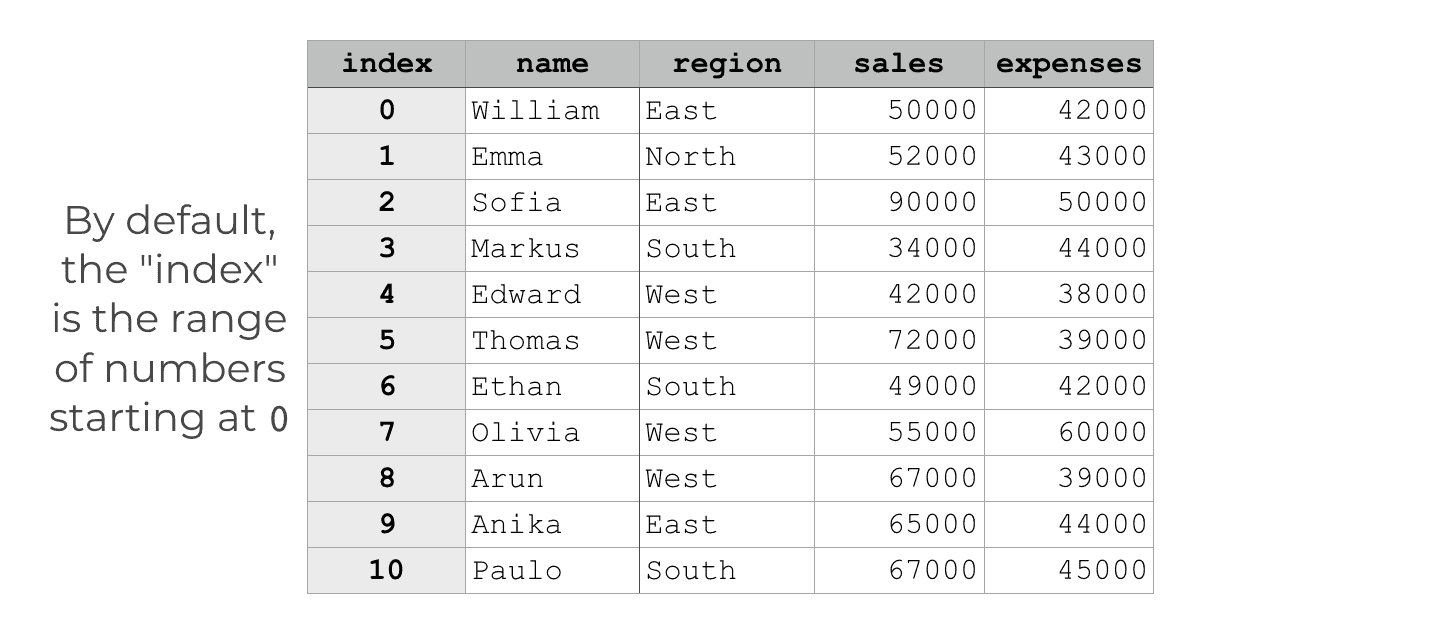
By default, if we don’t specify another index in some way, every DataFrame has an index like this.
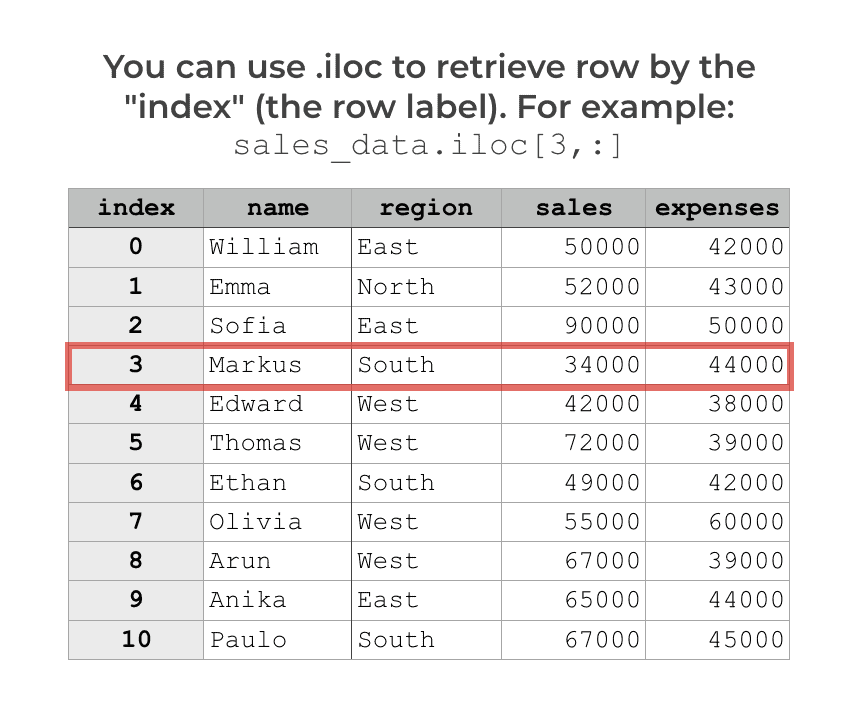
The individual integer values of the index enable us to retrieve specific rows. For example, if we have a DataFrame called sales_data, we can use the Pandas iloc method to retrieve a single row of data using the integer location of the row.
However, this creates a problem: you have to remember the exact integer for every row.
What if you have a DataFrame called sales_data like the one shown above. And let’s say that you want to retrieve the data for ‘Markus‘. To do this by integer index, you need to remember that Markus is at row 3. And you have to remember the integers for all of the other rows too. Maybe you can do it with 5 to 10 rows, but if you have a large dataset, it really becomes a pain in the ass.
If you want to retrieve the row for “Markus“, wouldn’t it be easier to be able to reference Markus in your syntax explicitly?
Yes.
And you can … if you set an index for your DataFrame.
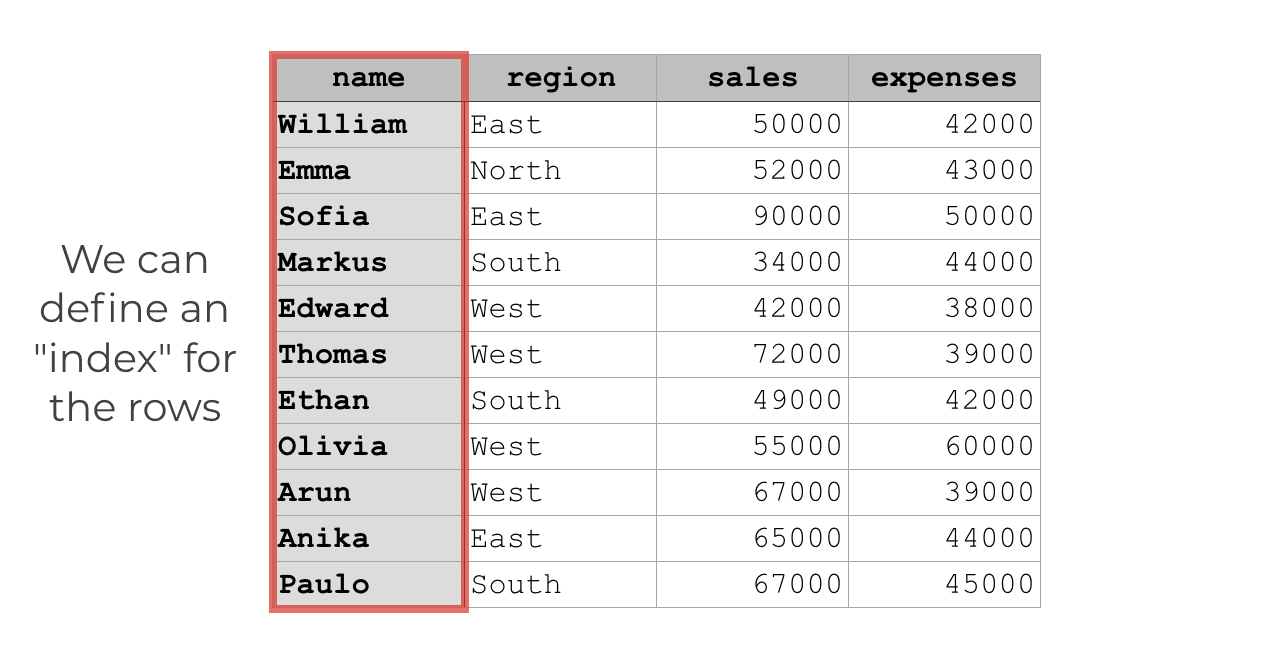
You can set a new index for your Pandas DataFrame
It’s possible to set a new index for a DataFrame.
Specifically, it’s possible to take one of the existing columns of a DataFrame, and turn it into an index that you can use for data retrieval.
To do this, you can use the Pandas set index method.
A quick introduction to Pandas set index
The Pandas set index method enables you to take one of the columns of a DataFrame and turn it into the index.
Once we do this, we can reference rows by the index value (i.e., the “label”) associated with the particular row.
The Pandas set_index method is the tool that we use to do this.
Let’s take a look at the syntax.
The syntax of Pandas set_index
The syntax for the set_index method is fairly straight forward in the simplest case.
In the simple version, you just type the name of your DataFrame, then a “dot”, then the name of the method, set_index().
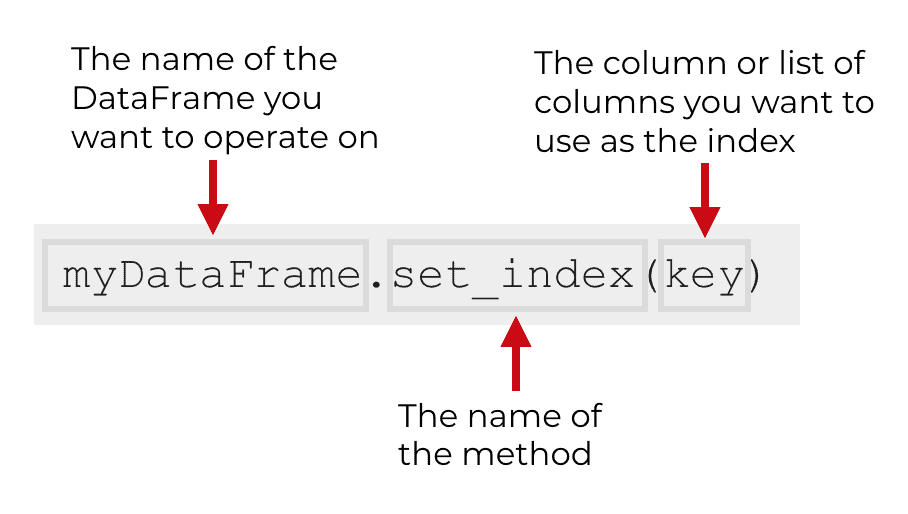
Inside of the parenthesis, you simply provide the name of the column that you want to use as the new index.
Having said that, the set_index method does have some additional parameters that enable you to control how the function works with greater precision. Let’s look at those.
The parameters of Pandas set_index
The set_index method has several parameters, including:
keysdropinplace
The method also has some additional parameters: append and verify_integrity.
These last two are less commonly used, so we won’t discuss them.
Having said that, let’s look at keys, drop, and inplace.
keys (required)
The keys parameter enables you to specify the column or columns that you want to use as the index.
In the simplest case, you can specify a single column. This is very common … probably the most common way to set an index for a DataFrame. Just use a single column.
However, it’s possible to use multiple columns as an index. To do this, you’ll provide a list or an “array like” group of columns/labels. This can get a little complicated, but in the simple case, you can just provide a list of column names to the keys parameter. I’ll show you an example of this in the examples section.
drop
The drop parameter enables you to specify whether or not the set_index method will “drop” the column that you set as the index.
When you transform a column into an index, set_index will “drop” that column. The new index is not really a column anymore. It will sort of appear like a column when you print out the DataFrame, but it will no longer be listed as a proper column.
That’s the default behavior. By default, the drop parameter is set to drop = True, which causes set index to drop the column when it creates the index from that column.
However, you can override that behavior. If you set drop = False, set_index will transform the column into the index, but it will also keep the old column.
There are a couple of reasons that you might want to do this, particularly if you need to use the old column for things like data visualization (i.e., you need to use the column in a chart or graph).
inplace
The inplace parameter enables you to modify your DataFrame “in place.”
By default, the inplace parameter is set to inplace = False. That means that the set_index method does not directly modify the original DataFrame. Instead, when inplace is set to False, the method produces a new DataFrame.
If you want to directly modify the original DataFrame, you need to set inplace = True. I’ll show you an example of this in the examples section.
The output of set_index
As I just mentioned above, the set_index method produces a new Pandas DataFrame by default.
That means that by default, the original DataFrame will be left unchanged.
That said, if you set inplace = True, then set_index will directly modify the original DataFrame, and will not produce any output.
Examples: how to set the index of a Pandas DataFrame
Ok. Now that you’ve learned about the syntax, let’s take a look at some examples of set_index.
Examples:
- Set a DataFrame index with set_index
- Set the index “in place”
- Keep the original column while setting the index
- Use multiple variables as an index
Run this code first
Before you run any of these examples, you’ll need to run some preliminary code first.
Import Pandas
First of all, you’ll need to import the Pandas package.
This is very simple. You can just run the following code:
import pandas as pd
Here, we’re essentially just importing the Pandas package with the nickname “pd”. This enables us to call Pandas functions and tools with that short nickname (you’ll see this next when we create our DataFrame).
Create Pandas DataFrame
Now, let’s create a Pandas DataFrame.
To do this, we’re going to call the Pandas “DataFrame” function, pd.DataFrame().
sales_data = pd.DataFrame({
"name":["William","Emma","Sofia","Markus","Edward","Thomas","Ethan","Olivia","Arun","Anika","Paulo"]
,"region":["East","North","East","South","West","West","South","West","West","East","South"]
,"sales":[50000,52000,90000,34000,42000,72000,49000,55000,67000,65000,67000]
,"expenses":[42000,43000,50000,44000,38000,39000,42000,60000,39000,44000,45000]})
Here, we’re just creating a simple DataFrame with “dummy” sales data. The dataframe – sales_data – contains 4 variables: name, region, sales, and expenses.
Let’s quickly print out the data.
print(sales_data)
OUT:
       name region  sales  expenses
0   William   East  50000     42000
1      Emma  North  52000     43000
2     Sofia   East  90000     50000
3    Markus  South  34000     44000
4    Edward   West  42000     38000
5    Thomas   West  72000     39000
6     Ethan  South  49000     42000
7    Olivia   West  55000     60000
8      Arun   West  67000     39000
9     Anika   East  65000     44000
10    Paulo  South  67000     45000
Notice that there are 11 rows.
Also, notice that each row has a number next to it, on the left hand side of the printed DataFrame (the numbers from 0 to 10).
Those numbers are the index.
Retrieve DataFrame index
Let’s quickly retrieve the index, so you can see it:
print(sales_data.index)
OUT:
RangeIndex(start=0, stop=11, step=1)
By default, the index for the DataFrame is something we call a “RangeIndex“. Don’t let this confuse you. The syntax RangeIndex(start=0, stop=11, step=1) simply means that the index is the set of numbers from 0 to 10, including 10 (the stop number, stop=11, is not included).
Again, to recap: We now have a Python DataFrame with an index. The index is the range of numbers from 0 to 10.
Now, we’re ready to change the index using the Pandas set_index function.
EXAMPLE 1: Set a DataFrame index with set_index
Here, we’re going to set the index of the sales_data DataFrame using the Pandas set_index method.
To do this, we’re going to type the name of the DataFrame, then a “dot”, and then the function name, set_index().
Inside of the parenthesis, we will provide the name of the column that we want to set as the index. In this case, we’re going to use the name variable as the index.
Let’s take a look at the code:
sales_data.set_index('name')
And here is the output:
        region  sales  expenses
name
William   East  50000     42000
Emma     North  52000     43000
Sofia     East  90000     50000
Markus   South  34000     44000
Edward    West  42000     38000
Thomas    West  72000     39000
Ethan    South  49000     42000
Olivia    West  55000     60000
Arun      West  67000     39000
Anika     East  65000     44000
Paulo    South  67000     45000
Notice a few things:
First of all, notice that in the output, the integer index values that we had before are gone.
In place of those integer index values, we now have the “name” variable. The “name” variable is now set off to the left side of the DataFrame. It’s sort of set apart from the columns. That’s because it’s not really a column anymore. The names have become the index values for the rows.
Another thing to notice, is that when you run the code, the output will go directly to the console window (if you’re working in an IDE, for instance).
That’s because the set_index method creates a new DataFrame by default. Because we did not store the output in a new variable, the output should just go straight to the output console.
Moreover, the original DataFrame should be unchanged.
Let’s print out sales_data so you can see it:
print(sales_data)
OUT:
       name region  sales  expenses
0   William   East  50000     42000
1      Emma  North  52000     43000
2     Sofia   East  90000     50000
3    Markus  South  34000     44000
4    Edward   West  42000     38000
5    Thomas   West  72000     39000
6     Ethan  South  49000     42000
7    Olivia   West  55000     60000
8      Arun   West  67000     39000
9     Anika   East  65000     44000
10    Paulo  South  67000     45000
As you can see, the sales_data DataFrame still has the integer index.
That’s because by default, the Pandas set_index function has the inplace parameter set to inplace = False. That means that when we ran the code sales_data.set_index('name'), set_index did not change the original DataFrame. It simply produced a new DataFrame as an output, and sent that output directly to the console.
Having said that, it is possible to change the original DataFrame directly.
Let’s do that.
EXAMPLE 2: Set index in place
In this example, we’re going to set the index “in place” by using the inplace parameter.
To do this, we’re going to set inplace = True in our syntax.
Before we do that though, let’s create a copy of sales_data.
The reason that we’ll make a copy is because when we use inplace = True, the set_index method will overwrite the data. I don’t want to overwrite sales_data directly (because we’ll need it for other examples), so we’ll make a copy first.
Copy dataframe
Here, we’ll just copy the DataFrame:
sales_data_copy = sales_data.copy()
This new DataFrame, sales_data_copy, contains the exact same data as sales_data, including the original integer “range index”.
Set dataframe index in place
Now that we have a DataFrame that we can work with, let’s set the index.
Here, we’re going to set the set the index to name with the set_index method, but here, we’re going to use the syntax inplace = True.
sales_data_copy.set_index('name', inplace = True)
And let’s print it out now:
print(sales_data_copy)
OUT:
        region  sales  expenses
name
William   East  50000     42000
Emma     North  52000     43000
Sofia     East  90000     50000
Markus   South  34000     44000
Edward    West  42000     38000
Thomas    West  72000     39000
Ethan    South  49000     42000
Olivia    West  55000     60000
Arun      West  67000     39000
Anika     East  65000     44000
Paulo    South  67000     45000
As you can see, the name variable is now the index for the sales_data_copy DataFrame. You can check that with the code print(sales_data_copy.index).
What this means is that by setting the inplace parameter to inplace = True, the code modified the DataFrame directly. It actually wrote over sales_data_copy and replaced it with this new version of the data with the new index.
Quick note: you can reset the index
Just so you’re aware: it is possible to reset the index.
So, if you accidentally set the wrong index, you can use the reset_index method to turn the index back into a regular column.
EXAMPLE 3: Keep the original column while setting the index
I’ve pointed out (and you may have noticed) that whenever we set a new index for a Pandas DataFrame, the column we select as the new index is removed as a column. For example, in the past examples when we set name as the index, name was no longer a “proper” column.
This is because by default, when we use set_index, the drop parameter is set to drop = True. This means that by default, set index will transform the “key” variable into the index, but it will also drop that variable as an actual column. This is a subtle distinction. The index sort of looks like a column, but it’s not a column, per se.
That being the case, in this example, we’re going to use set index with drop = False in order to keep the original variable as a proper column, while also transforming it into the index.
Specifically, we’re going to set the index to the name variable, but we’re going to keep the original name column in the DataFrame.
Let’s take a look:
sales_data.set_index('name', drop = False)
OUT:
            name region  sales  expenses
name
William  William   East  50000     42000
Emma        Emma  North  52000     43000
Sofia      Sofia   East  90000     50000
Markus    Markus  South  34000     44000
Edward    Edward   West  42000     38000
Thomas    Thomas   West  72000     39000
Ethan      Ethan  South  49000     42000
Olivia    Olivia   West  55000     60000
Arun        Arun   West  67000     39000
Anika      Anika   East  65000     44000
Paulo      Paulo  South  67000     45000
Notice that “name” exists as the index for the sales_data DataFrame, but it also exists as a column of the DataFrame.
This is somewhat useful.
There will be times when you’d like to use a column as the index, but you’ll still need it as a column as well.
For example, if you’re doing data visualization in Python (i.e., with Seaborn), there are some tools that will only work with a column; there are cases where the visualization technique will not work with the index. In these cases, it’s good to be able to set drop = False if you need a variable as both the index and a column.
EXAMPLE 4: Use multiple variables as an index
Finally, I’m going to show you how to use multiple columns as a DataFrame index.
To be clear: using multiple indexes for a DataFrame can get complicated. There are some complicated ways you can structure the index. Moreover, choosing good columns as an index is a bit of an art in itself.
Having said that, this example will be a very simple example of how to use multiple columns as an index.
To do this, we’re simply going to provide the names of two variables inside of a Python list.
Let’s take a look:
sales_data.set_index(['name','region'])
OUT:
                sales  expenses
name    region
William East    50000     42000
Emma    North   52000     43000
Sofia   East    90000     50000
Markus  South   34000     44000
Edward  West    42000     38000
Thomas  West    72000     39000
Ethan   South   49000     42000
Olivia  West    55000     60000
Arun    West    67000     39000
Anika   East    65000     44000
Paulo   South   67000     45000
Here, we set two variables as the index: name and region.
We assigned these variables as the index by passing them to set_index inside of a list. The input to set_index was the list ['name','region'].
In the output, you can see that both columns – name and region – are included in the new index.
Frequently asked questions about Pandas set index
Now that you’ve seen some examples of set_index, let’s review some frequently asked questions.
Frequently asked questions:
- Pandas set_index is not setting the index of my DataFrame … Why?
- Can I use multiple columns as an index?
- How do I keep the index column in the DataFrame?
- How do I convert the index back into a column?
Question 1: Pandas set_index is not setting the index of my DataFrame … Why?
What’s probably going on is you’re using set_index without using the inplace parameter.
As mentioned above, by default, the set_index method does not modify the original DataFrame. By default, set_index produces a new DataFrame.
To change this behavior, and to directly modify your original data, you can set inplace = True. But be careful! Doing this will overwrite your DataFrame.
For a clear example of this, check out example 2 of this tutorial.
Question 2: Can I use multiple columns as an index?
Yes.
Check out example 4 of this tutorial.
Question 3: How do I keep the index column as a column in the DataFrame?
You can use the drop parameter and set drop = False.
This will keep the original variable in the DataFrame as a column, in addition to turning it into the index.
For more information about this, see example 3 of this tutorial.
Question 4: How do I convert the index back into a column?
To convert the index back into a normal column, you can use the Pandas reset_index method.
For more information, read our tutorial on Pandas reset_index.
Leave your other questions in the comments below
Do you have other questions about the Pandas reset index method?
Leave your questions in the comments section below.
Join our course to learn more about Pandas
If you’re serious about learning Pandas, you should enroll in our premium Pandas course called Pandas Mastery.
Pandas Mastery will teach you everything you need to know about Pandas, including:
- How to subset your Python data
- Data aggregation with Pandas
- How to reshape your data
- and more …
Moreover, it will help you completely master the syntax within a few weeks. You’ll discover how to become “fluent” in writing Pandas code to manipulate your data.
Find out more here:
Nice tutorial. Very easy to understand with good examples
????
A very good explanation
awesome, thanks for sharing! Can you talk a bit more about ‘unique’ constraints when dealing with indexes? you can do that in sql, but what about pandas?
What exactly do you mean by “‘unique’ constraints”?
If you can be more specific, I might be able to provide a good answer.