This tutorial is part of a series of tutorials analyzing covid-19 data.
For part 1, see the following post:
https://www.sharpsightlabs.com/blog/python-data-analysis-covid19-part1/
Covid19 analysis, part 2: merge datasets
In the previous tutorial in this series, we began analyzing covid19 data using Python.
Specifically, in part 1, we created a process for getting the covid19 data for confirmed cases and “wrangling” it into shape using Pandas.
That was a good start, but there’s more data beyond just the confirmed cases. The github repository from which we imported the data also has data for covid19 deaths and recovered cases.
Ultimately, what I want is a dataset that has all of that data combined.
That being said, in this tutorial, we’re going to get all of the datasets and merge them together.
This will take some extra work, for a few reasons:
- there are multiple datasets
- all of the datasets are in the “wrong” shape
- our process from part1 was not highly “repeatable”
These are all solvable problems.
With all of this in mind, in this tutorial, we’re going to create a repeatable process for importing and wrangling the data.
We’ll use that process to import all three datasets: the data for confirmed cases, recovered cases, and deaths.
Then finally we’ll merge the data together to create a “master” dataset.
Let’s get to it.
Our general process
In this tutorial, we’re going to create a group of functions that will enable us to “wrangle” our datasets in a repeatable way. I want to “proceduralize” the data gathering process.
After we define the functions, we’ll apply those functions to the covid19 csv files to get and wrangle the data.
Finally, we’ll merge it all together.
Here’s a table of contents that will enable you to jump to a specific section:
Table of Contents:
- Rename columns
- Fill missing values
- Reshape (melt) data
- Convert dates
- Rearrange data
- Get csv files
- Merge data
Also, as you read through the tutorial, remember this: all of the functions that we’re about to create are based on the script from part 1.
If you’re a little confused, you might want to review part 1 first.
Import python packages
Quickly, before we do any real work, we’ll need to import a few Python packages.
To do that, run the following code:
import pandas as pd
import datetime
Ok. We’re ready.
Define function: rename columns
Our first function will be a function for renaming the columns.
To be clear, the first step when we run these, will actually be to import the data. But, we already have a good function for that. We can use Pandas read_csv to import the data.
But after we import, our first step will be to rename the columns.
Here, we’re defining a function called covid_rename_columns that will rename the columns of the raw data file. Ultimately, I want to clean up the column names to make them more readable, to remove characters like “/“, and to make everything lower case.
def covid_rename_columns(input_data):
    output_data = input_data.rename(
                              columns = {'Province/State':'subregion'
                                         ,'Country/Region':'country'
                                         ,'Lat':'lat'
                                         ,'Long':'long'
                                         }
                              )
    return(output_data)
This is fairly straightforward.
We’re creating an input argument called input_data that enables us to pass a DataFrame into the function.
Inside, we’re using the Pandas rename method to rename the columns of the DataFrame. We then return the output as output_data.
Define function: fill missing (UPDATED CODE)
(Just a quick note: this section is an updated section added on April 8.)
Here, we’re going to create a function to fill in some missing values in the the subregion variable.
def covid_fill_missing(input_data):
    output_data = input_data.fillna(value = {'subregion':''})
    return(output_data)
This will fill in NaN values with an empty string.
(This is necessary for some data manipulation and processing later.)
Define function: melt data
Next, we’ll define a function to reshape the data into a “tidy” shape.
You’ll recall from part 1 that in the raw data, the dates exist as separate columns.
That’s not really what we want. We want the dates to exist as values underneath a single date column.
So in part 1, we created a process where we reshaped the data to create a new date column (called date_RAW) and also a value column.
When we did this in part 1, we called the value column confirmed, because we were working with the confirmed cases.
In this tutorial though, we want to define a function that will be more general, so we can use it to reshape our confirmed data, recovered data, and deaths data.
So here, we’re creating a function called covid_melt_data. This function will accept a DataFrame as the first argument, and a variable name (a string) as the second argument.
def covid_melt_data(input_data, value_var_name):
    output_data = input_data.melt(id_vars = ['country','subregion','lat','long']
                                  ,var_name = 'date_RAW'
                                  ,value_name = value_var_name
                                  )
    return(output_data)
The function reshapes the data so that the dates (which are columns in the original data) will be transposed into values. At the same time, it creates a value variable that we can name. When we eventually use this function towards the end of this tutorial, we’ll call the value variables “confirmed“, “recovered“, and “dead” for our respective confirmed, recovered, and deaths DataFrames.
Define function: convert dates
Next, we’ll define a function to help us convert the dates in the DataFrames.
Remember from part 1 that after reshaping the data, the dates were still in a string format.
That’s not what we want. We want the date to be in a “datetime” format.
In part 1, we solved this by simply using the Pandas to_datetime method to create a new field called “date“.
Here, we’re going to do the same thing, but we’ll wrap that in a function:
def covid_convert_dates(input_data):
    output_data = input_data.assign(
         date = pd.to_datetime(input_data.date_RAW, format='%m/%d/%y')
         )
    output_data.drop(columns = ['date_RAW'], inplace = True)
    return(output_data)
Inside of this function, we’re using the Pandas assign method to create a new variable. More specifically, we’re using the to_datetime function to transform date_RAW into a proper datetime, and we’re calling the new output date.
In the second to last line of the function, we delete the date_RAW field by using the drop method.
So in from the input data, we take the date_RAW field, use that to create a datetime called date, drop the original date_RAW column, and then return the output, output_data.
Define function: rearrange data
Now, we’ll define a function to rearrange the data.
You’ll recall from part 1 of this data analysis tutorial series, after finishing most of the data processing, the data were still a little “disordered”.
For example, the the date column was at the end of the DataFrame. It would have been better to have the data column as one of the first few columns; doing that makes the columns easier to read when you’re looking at dates and analyzing data.
Also, the data were not really sorted by country or date.
In sum, the rows and columns were a little out of order.
So we reordered the columns and sorted the rows.
Here, we’ll do that with a new function.
We’ll define a function called covid_rearrange_data that will reorder the columns and then sort the rows:
def covid_rearrange_data(input_data,value_var_name):
    output_data = (input_data
                   .filter(['country', 'subregion', 'date', 'lat', 'long', value_var_name])
                   .sort_values(['country','subregion','date','lat','long'])
                   .reset_index(drop = True)
                   )
    return(output_data)
Here, we’re reordering the data to put country, subregion, and date towards the front, among the first few columns.
We’re also using sort_values to sort the rows by country, subregion, and date.
The function returns a DataFrame.
Define function: get and wrangle data
Now, we’ll create a function that just combines our previous functions into a single function.
This new function, covid_get_data, accepts a URL as the first argument.
The second argument is value_var_name. This will enable us to create different “value” variables for our different covid-19 datasets. (i.e., we’ll create a “deaths” variable for the deaths data, a “confirmed” variable for the confirmed data, etc.)
def covid_get_data(input_url, value_var_name):
    covid_data_inprocess = pd.read_csv(input_url)
    covid_data_inprocess = covid_rename_columns(covid_data_inprocess)
    covid_data_inprocess = covid_fill_missing(covid_data_inprocess)
    covid_data_inprocess = covid_melt_data(covid_data_inprocess,value_var_name)
    covid_data_inprocess = covid_convert_dates(covid_data_inprocess)
    covid_data_inprocess = covid_rearrange_data(covid_data_inprocess, value_var_name)
    return(covid_data_inprocess)
This is pretty straight forward.
We’re just combining the previous functions into one function that we can execute to get the csv files from Github and wrangle them into shape.
Get data
Ok. Almost there.
We now have a single function, covid_get_data, that can get and clean up the covid-19 datasets.
All we need to do is call the function with the URL of the csv file, and provide the name of a “value variable” for each dataset.
So here, we’ll store the locations of each csv file (url_confirmed, url_deaths, url_recovered), and we’ll call covid_get_data with those URLs.
(Note: the following file URLs were updated on March 30, 2020 after the Johns Hopkins CSSE team changed the file location.)
# OLD FILES
# url_confirmed = 'https://raw.githubusercontent.com/CSSEGISandData/COVID-19/master/csse_covid_19_data/csse_covid_19_time_series/time_series_19-covid-Confirmed.csv'
# url_deaths = 'https://raw.githubusercontent.com/CSSEGISandData/COVID-19/master/csse_covid_19_data/csse_covid_19_time_series/time_series_19-covid-Deaths.csv'
# url_recovered = 'https://raw.githubusercontent.com/CSSEGISandData/COVID-19/master/csse_covid_19_data/csse_covid_19_time_series/time_series_19-covid-Recovered.csv'

# NEW FILES
url_confirmed = 'https://raw.githubusercontent.com/CSSEGISandData/COVID-19/master/csse_covid_19_data/csse_covid_19_time_series/time_series_covid19_confirmed_global.csv'
url_deaths = 'https://raw.githubusercontent.com/CSSEGISandData/COVID-19/master/csse_covid_19_data/csse_covid_19_time_series/time_series_covid19_deaths_global.csv'
url_recovered = 'https://raw.githubusercontent.com/CSSEGISandData/COVID-19/master/csse_covid_19_data/csse_covid_19_time_series/time_series_covid19_recovered_global.csv'


covid_confirmed = covid_get_data(url_confirmed,'confirmed')
covid_deaths = covid_get_data(url_deaths,'dead')
covid_recovered = covid_get_data(url_recovered,'recovered')
After running this, you’ll have three datasets.
Print records
Quickly, let’s print out some records:
print(covid_confirmed)
OUT:
           country subregion       date   lat  long  confirmed
0      Afghanistan       NaN 2020-01-22  33.0  65.0          0
1      Afghanistan       NaN 2020-01-23  33.0  65.0          0
2      Afghanistan       NaN 2020-01-24  33.0  65.0          0
3      Afghanistan       NaN 2020-01-25  33.0  65.0          0
4      Afghanistan       NaN 2020-01-26  33.0  65.0          0
           ...       ...        ...   ...   ...        ...
28138     Zimbabwe       NaN 2020-03-16 -20.0  30.0          0
28139     Zimbabwe       NaN 2020-03-17 -20.0  30.0          0
28140     Zimbabwe       NaN 2020-03-18 -20.0  30.0          0
28141     Zimbabwe       NaN 2020-03-19 -20.0  30.0          0
28142     Zimbabwe       NaN 2020-03-20 -20.0  30.0          1
Excellent. This looks like what we want.
Here in the covid_confirmed data, we have a DataFrame that contains the countries, dates, locations, and confirmed covid-19 cases.
The other 2 datasets contain data with a similar structure, except covid_deaths contains deaths, and covid_recovered contains recovered cases.
Get record counts
One last thing before we move on.
Let’s get the record counts.
len(covid_confirmed) # 17204
len(covid_deaths)    # 17204
len(covid_recovered) # 16252
I’m doing this, because our next and final step will be to merge these datasets together.
When we perform a merge, we typically want to watch the number of records before and after the merge … particularly if the different datasets have a different number of records.
This is actually good, because all of the input datasets have the same number of records. That means that we’ll probably have fewer issues with the merge
(Note: the data in this tutorial were pulled on March 21, 2020 … if you pull the data on a future date, your datasets may have a larger number of records.)
Merge data
Finally, we’ll merge these 3 datasets together.
Remember: ultimately, we want a single DataFrame that contains covid-19 confirmed cases, deaths, and recoveries at the level of location-date.
Again, to get this, we need to merge together covid_confirmed, covid_deaths, and covid_recovered.
Drop unnecessary columns
Before we merge the data together, we’re going to drop some extra variables. We’ll drop lat and long in covid_deaths and covid_recovered.
We won’t use them as fields for our merge process, and if we keep them in, they will show up as duplicate columns in the output DataFrame.
covid_deaths.drop(columns = ['lat','long'], inplace = True)
covid_recovered.drop(columns = ['lat','long'], inplace = True)
Now we’re ready.
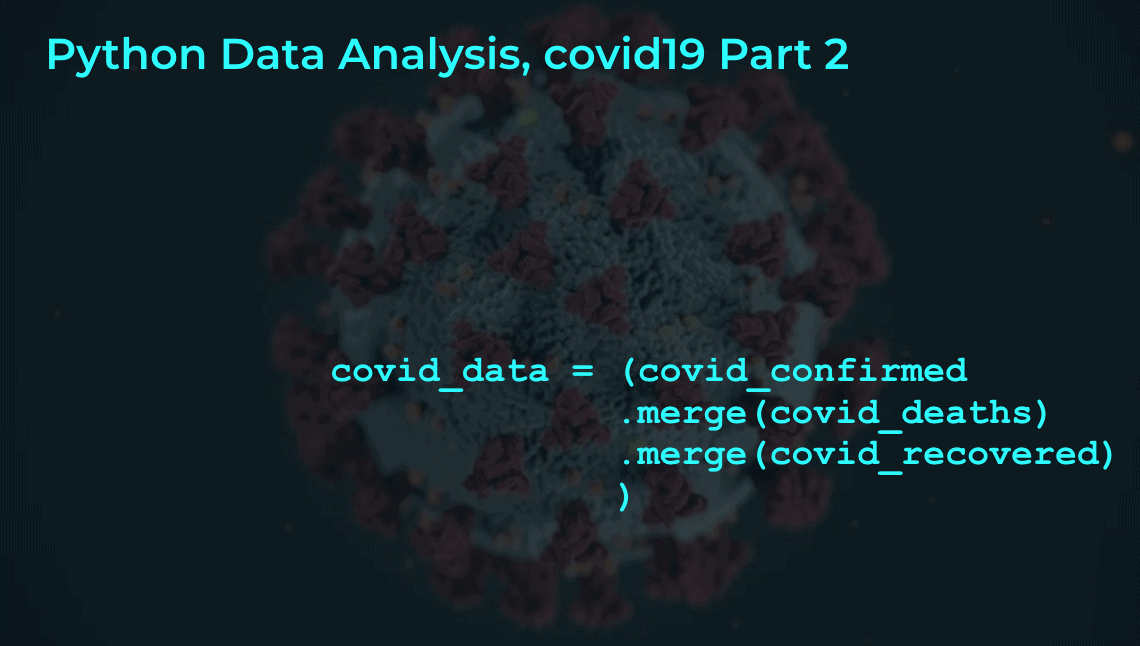
Merge data
Here, we’ll merge together covid_confirmed, covid_deaths, and covid_recovered using the Pandas merge method:
covid_data = (covid_confirmed
                .merge(covid_deaths, on = ['country','subregion','date'], how = 'left')
                .merge(covid_recovered, on = ['country','subregion','date'], how = 'left')
             )
Here, we’re merging together all three datasets on country, subregion, and date.
We’re also performing this as a “left” merge, which means that the merge process will keep all of the rows from covid_confirmed, and tack on any additional columns from covid_deaths and covid_recovered.
Print records
And now let’s take a look with a print statement.
print(covid_data)
OUT:
           country subregion       date   lat  long  confirmed  dead  recovered
0      Afghanistan       NaN 2020-01-22  33.0  65.0          0     0          0
1      Afghanistan       NaN 2020-01-23  33.0  65.0          0     0          0
2      Afghanistan       NaN 2020-01-24  33.0  65.0          0     0          0
3      Afghanistan       NaN 2020-01-25  33.0  65.0          0     0          0
4      Afghanistan       NaN 2020-01-26  33.0  65.0          0     0          0
           ...       ...        ...   ...   ...        ...   ...        ...
28138     Zimbabwe       NaN 2020-03-16 -20.0  30.0          0     0          0
28139     Zimbabwe       NaN 2020-03-17 -20.0  30.0          0     0          0
28140     Zimbabwe       NaN 2020-03-18 -20.0  30.0          0     0          0
28141     Zimbabwe       NaN 2020-03-19 -20.0  30.0          0     0          0
28142     Zimbabwe       NaN 2020-03-20 -20.0  30.0          1     0          0
Excellent. This is what we’re looking for.
We have a single DataSet that combines confirmed, dead, and recovered in a single dataset, at the country/date level.
Update: add new cases
This section is an update to the tutorial.
In part 5 of this tutorial series, we calculated the daily new cases for each country.
Calculating the new cases by country is a little challenging, particularly if you’re a beginner. So in part 5, I explained how to do this, step by step.
But the “new cases” variable will be important to future analyses, so I’ve added the finalized code here to calculate the daily new cases by country, and add that as a new variable to our covid_data dataframe.
Calculate daily new cases
First we’ll calculate the new cases.
new_cases_ALL = (covid_data
 .sort_values(by = ['country', 'subregion', 'date'])
 .filter(['country','subregion','date','confirmed'])
 .groupby(['country','subregion'])
 .confirmed
 .diff()
)
And now we’ll add the new cases to the covid_data dataframe:
covid_data = covid_data.assign(new_cases = new_cases_ALL)
The daily new cases have been added to the dataframe as new_cases.
Next steps
Right now, we’re in a pretty good spot.
We now have a combined dataset that’s in “tidy” form.
Here are a few things that we could still do:
I definitely want to check the data. Although we have it combined into a single DataFrame, we haven’t run through any checks. I’d like to do some quick-and-dirty aggregations and analysis to see if the data look “correct”.
After that, we can start doing some data visualization and analysis to dig into the data. At minimum, it would be instructive for you (the reader) to try to recreate some charts and graphs that are floating around the internet right now. There are some charts and visualizations currently that show the number of cases by country, the growth of cases, and other visualizations. It might be fun to recreate those using Python.
And there might be some other opportunities.
What else? What else do you want to see in this tutorial series?
Leave a comment in the comments section below and tell me.
Sign up to learn more
Do you want to see part 3 and the other tutorials in this series?
Sign up for our email list now.
When you sign up, you’ll get our tutorials delivered directly to your inbox.
Another great tutorial Josh. I have found some great visualizations in R and Python that will keep me busy all week to learn more about Covid-19 and build upon this tutorial.
A Part 3 would be fantastic. There are so many possibilities your courses and tutorials have me thinking about in regards to Covid-19. How much has the outbreak affected countries import /exports, corporate / agriculture production? Comparing Covid-19 to other outbreaks in the 2000s or throughout history. Price gouging in the United States during times of crisis or panic. Loss of revenue for March Madness, NBA, MLB and NHL.
Thank you for these tutorials and helping me become a better data scientist.
You’re welcome, Michael. Good to hear that they’re useful.
Part 3 is on the way ….
How many parts of this tutorial has been published???
Part 3 is up!
https://www.sharpsightlabs.com/blog/analyzing-covid-19-with-python-part-3-eda/
Excellent, keep it up!
????????????
si,
Muchas gracias, ahora en este tiempo de coronavirus, aprovechamos para aprender.
Saludos
Edward.
Thank you for this tutorial. It definitely helps for someone who is a beginner like me. I was able to read the data for both confirmed and dead files. However, after I merged all 3 files, the number of cases in confirmed, dead and recovered are identical. Can you please help me with this issue?
Hey Rachel,
I’d like to give you some help, but it’s a little difficult without more information. (I reran all of the code, and it worked OK on my side.)
For me to give you some guidance, you need to give more information on the exact output.
Are you talking about the finalized
covid_datadataframe?Have you printed out subsets using the query method?
For example:
covid_data.query('country == "US"')covid_data.query('country == "Italy"')Also, were there any errors when you ran the code?