Probably the most common question I get from new data science students is, “Which language should I learn … R or Python?”
This is a somewhat complex question to answer, because it depends on who you are and what your goals are.
Having said that, I do have a preference for first time data scientists.
R.
There are a few reasons why, but at a high level, the main reasons are:
- R is easier to learn and use
- R teaches you to think about workflow
- R is better for “junior” data science roles
Let’s discuss each of these reasons, one at a time.
R is easier to learn and Use
Personally, I think that R is much easier to learn and much easier to use.
A lot of the reason for this comes down to how it was designed.
Well named functions
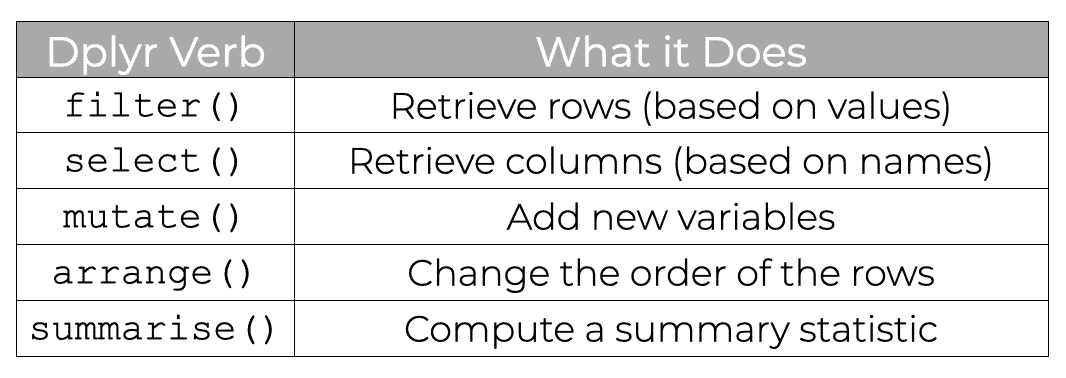
It starts with the function names. For example, when you use dplyr, there are a few main tools:
- select
- filter
- mutate
- summarise
- groupby
The names are simple and easy to remember.
“select” selects columns. “filter” filters rows. “summarise” summarises the data. The function names are like English language. This makes them incredibly easy to remember and also easier to use when you sit down to write your code.
Most of the functions from other R/Tidyverse packages like Tidyr, Forcats, and Reader are also very well named like this (although, the names in ggplot2 are a little more arcane).
Every function does one thing
One of the other good design features is that for the most part, every function in R’s Tidyverse does one thing, as opposed to doing multiple things.
For example, each dplyr function does one thing:
This is in contrast to the Python Pandas package, where functions sometimes do multiple things, and you need to control their behavior with specific parameters.
For example, the Pandas “filter” method can retrieve rows or columns. The exact behavior requires you to use the “axis=,” which in turn, requires you to understand how axes work in Pandas and Numpy. It’s just a lot more complicated to use. Additionally, there are multiple ways to retrieve columns and they all work a little differently.
It’s easy to “put the pieces together”
To do real data science work, you need to be able to combine multiple functions together in complex ways.
R’s Tidyverse is designed to do exactly this.
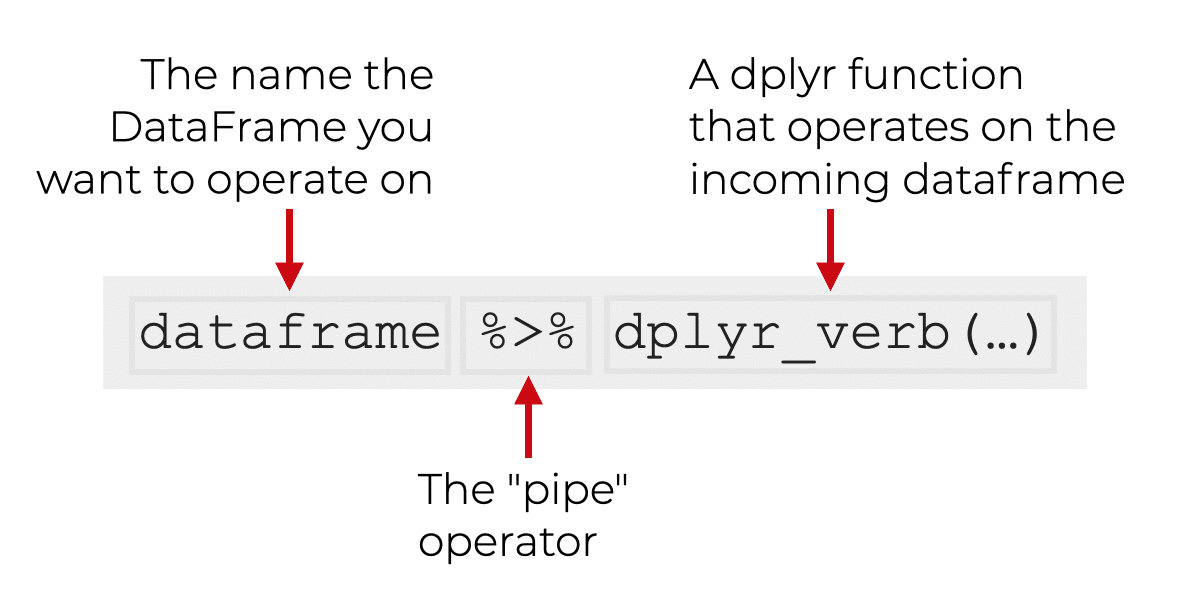
You can use the dplyr “pipe” syntax to combine different tools together. You can use them to combine dplyr functions to do data wrangling. But you can also use pipes with Tidyr, Readr, ggplot2, and other Tidyverse tools.
When you use this piping syntax, everything just snaps together like little Lego building blocks. “Putting the pieces together” to do real work becomes incredibly easy.
R is just easier to learn and use, all the way around
In the end, the Python data wrangling syntax is harder to learn and harder to use. But the R syntax is extremely simple and easy to use.
If you’re a beginner, R will probably be easier to learn, read, and write.
R teaches you to think about workflow
Second, R’s Tidyverse teaches you to think about workflow.
As I noted above, you can use the “pipe” operator to chain functions together.
You can use the pipe operator to combine two functions together.
But you can also use the pipe operator to combine multiple functions together into multi-function processing chains.
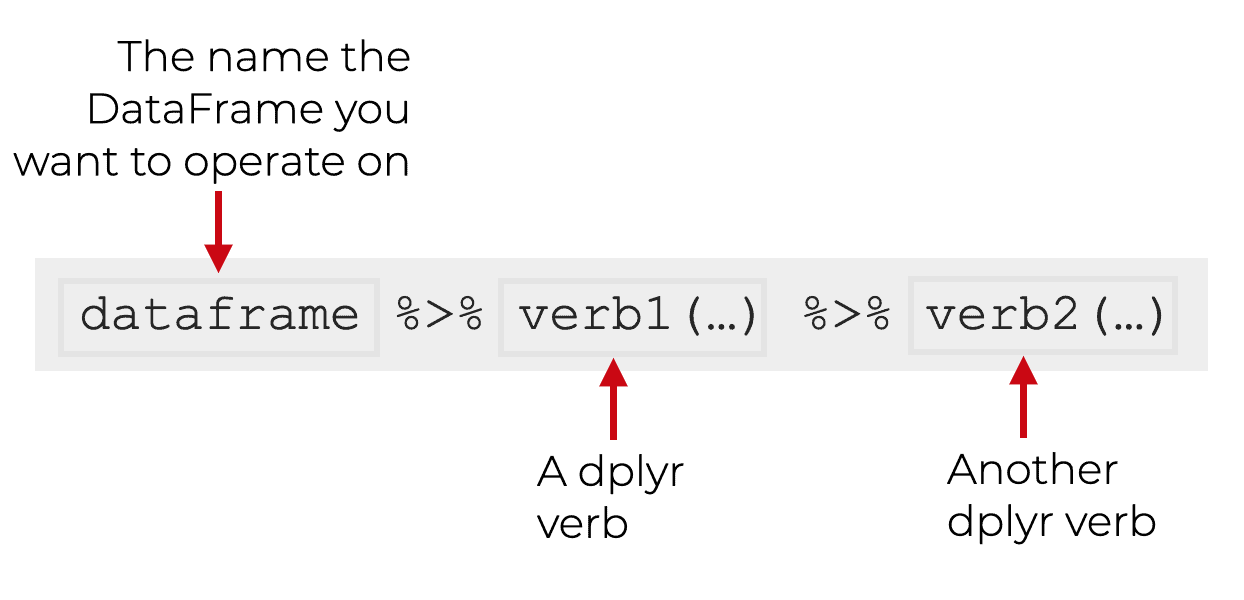
This enables you to write multi-step blocks of code to process your data.
And you can combine those blocks of code into larger scripts to do end-to-end data science work that incrementally wrangles, visualizes, and analyzes your data.
For example, here’s a small end-to-end R data science project that I did that shows you how everything fits together in terms of workflow.
Notice that the code is organized into block of functions that are chained together to do small tasks.
Also notice that there’s a top-to-bottom flow to the overall code, such that we first get the data, then clean it (step by step), then wrangle, then visualize.
R’s syntactical structure facilitates this. It’s built for it.
Because it’s designed with this type of workflow in mind, it will help you learn to think in terms of workflow.
This is incredibly important.
R is better for Junior Data Science roles
Finally, I like R better for “junior” data science roles.
What does this mean?
Data science is different at different levels, and at different points of your career.
At later stages, data science involves what we consider to be the full range of data science skills: data wrangling, visualization, machine learning, deep learning, special topics, etc.
But at early stages, data science is typically “hard core data analysis.”
Said differently, most entry level data science roles are data analytics roles. They very frequently exclude more advanced topics like machine learning and deep learning.
So at early levels, most data scientists will:
- get data
- cleaning data
- wrangling data
- visualize data
- analyze data
It’s often very much like a data analysis role, but with larger and more complicated datasets that you usually get from a database.
As it turns out, this is where R really shines. R is less good for topics like machine learning and deep learning (although that’s changing). But R is superb for data analytics.
Any time I need to get, clean, reshape, visualize, and analyze my data, I actually prefer R over Python.
(The reason, as I discussed earlier, is that it’s very well designed for these tasks and easy to use.)
Ultimately, if you spend most of your time wrangling, visualizing, and analyzing your data (and you don’t need to do advanced things) then I recommend R.
But sometimes, there are better options
Having said all of that, there are some cases when Python might be better.
If Your Target Company Requires a Different Language, R might be a bad choice
If you want to work for a company that strictly uses Python, then yes, you might need to learn Python instead.
To be clear: for data science roles, Apple, Facebook, Google, and Amazon all frequently let you choose between R and Python. It’s somewhat rare for a company to force you to use one data science language in particular.
If You’re Only Interested in Machine Learning, R might be a bad choice
If you’re only interested in machine learning, then Python might be better than R.
As of the time of writing this post, most machine learning in business or industrial settings is done with Python. Most professional machine learning engineers use Python.
But on the other hand, machine learning jobs are much harder to get. If you’re just getting started focusing strictly on machine learning is probably a bad idea.
If You want to do Software Engineering, R might be a bad choice
Finally, if you want to do more traditional software engineering, I recommend against using R.
As I mentioned previously, R is excellent at data wrangling, visualization, and data analysis. It’s great at “data analytics.”
But I strongly dislike it for building systems and writing software. The syntax for doing these things in R always feels complicated, idiosyncratic, and clumsy.
Any time I need to build systems, I prefer to use Python instead.
If You Want To Learn Data Science, R is an Excellent Choice
Deciding which data science language to learn is a personal choice, and it sometimes depends on individual circumstances.
But, very frequently, I recommend that people learn R … particularly if they are just getting started in data science.
The reasons are that R is easier to learn and use, R teaches you to think about workflow, and R is better for many junior data science roles.
What Do you think? What is your Favorite Data Science Language?
What do you think about this? Do you like R? Do you prefer a different language for data science?
Leave your comments in the comments section below.
Join our Premium R Data Science Course
If you’re ready to master data science in R and master ggplot2, dplyr, and the rest of the Tidyverse, you should join our course Starting Data Science with R. Starting Data Science is our premium course to help you master the essential tools of R data science as fast as possible.
We’re reopening the course for enrollment on Tuesday April 19, and if you want to get the enrollment email, make sure to sign up for our email list.
Only people who are on our email list are notified when we open enrollment for our courses!