Recently, I wrote a blog post stating that I’m starting to use Python for most of my data science work.
And I’m starting to recommend Python as the data science language to use for most beginners.
But is it always best?
No.
As always, it depends:
As I like to ask people: “Who are you and what are your goals?”
For some people, R is probably the better language.
R vs Python, Revisited
To understand my thoughts on when R is the better choice, we should review my thoughts on R vs Python generally.
I’ve written about the R vs Python debate several times over the last few years, and notably, my thinking on this is still mostly unchanged.
Let’s quickly review.
One Quick Note
One quick note before I review my R vs Python thoughts.
Recently someone in the comments seemed to deny that R or Python are data science languages. Specifically, he mentioned that Python is a “general purpose” language used for software engineering, and R is a “statistics” language.
There’s a sense in which those things are technically true, but in the context of all of my blog posts, it’s inaccurate.
When I write about “R vs Python,” what I’m typically comparing is “the R data science stack, with everything else it’s good at that might be complementary” vs “the Python data science stack, along with everything else it’s good at that might be complementary.”
Got that?
I’m comparing the R data science toolkit vs the Python data science toolkit, along with other complementary things that might be useful.
My Thoughts on R vs Python
Since visual representations are almost always a more direct way to show things, let’s look at my rough, quick and dirty, and not at all scientific heatmap of R vs Python for different sub-skills and areas of interest.
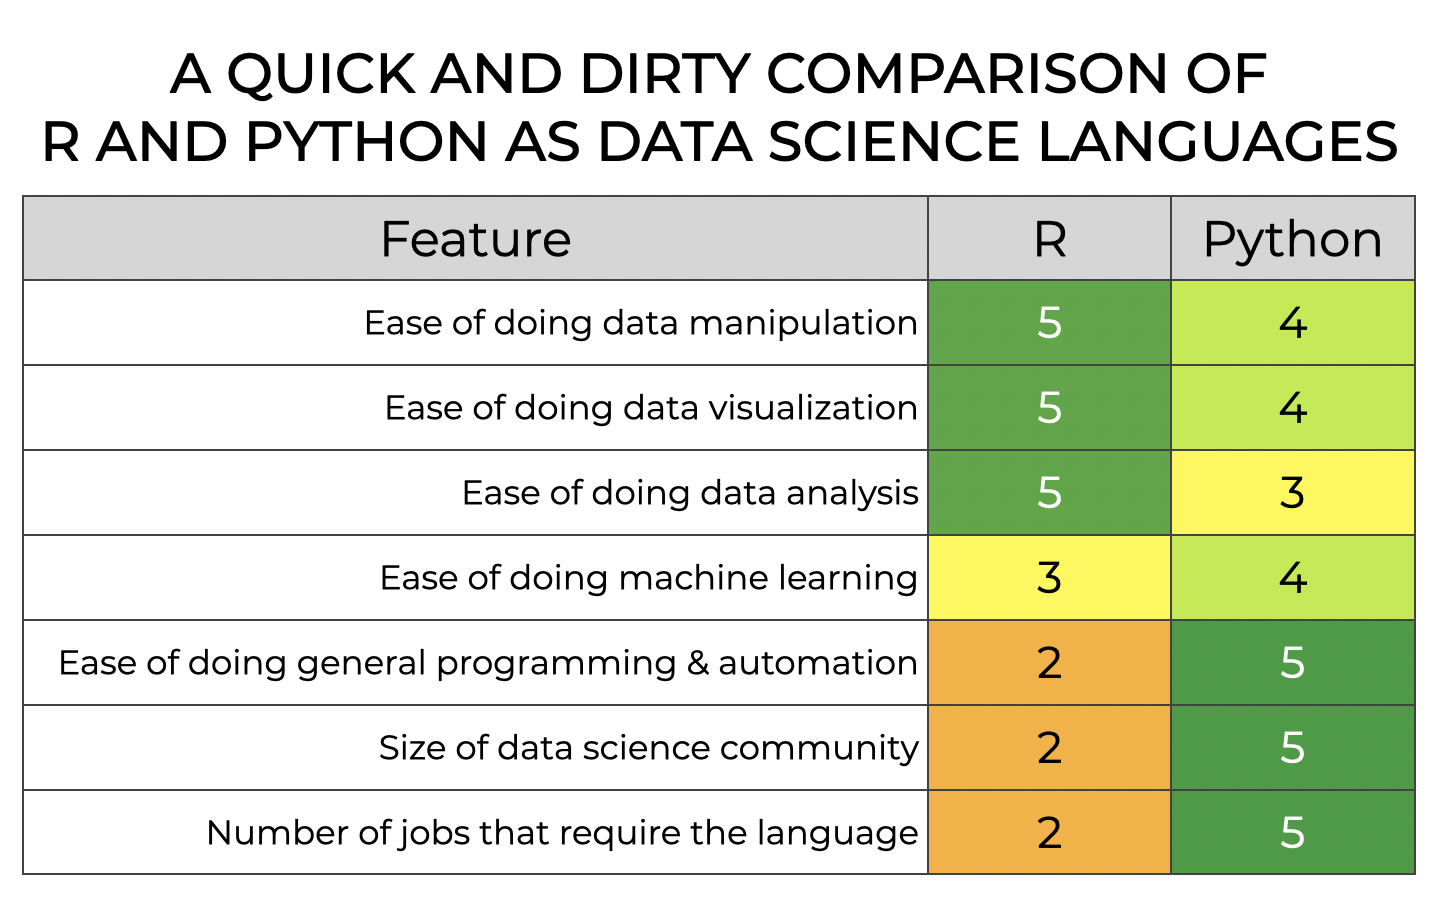
Let’s consider a few of the rows in this heatmap one at a time.
R is slightly better for Data Wrangling
If we look only in isolation, I’d argue that R’s dplyr is better at data wrangling than Python’s Pandas.
Dplyr’s syntax is more streamlined and easier to use.
A lot of this comes down to naming.
Do you want to “filter” the rows by some logical condition? In dplyr, you use the filter() function.
Do you want to “select” a specific set of columns? In dplyr, you use the select() function.
And so on.
Dplyr is simple, powerful, and easy to use.
Everything just snaps together like little LEGO blocks. This is particularly true when you use the pipe operator to chain tools together.
Personally, in isolation, I actually prefer dplyr to Pandas.
R is slightly better for Visualization
Next, let’s talk about data visualization.
In the above chart, I rate R as a 5 and Python as a 4 (note that I recently updated this chart to increase Python from 3 to 4 to account for the new Seaborn Objects system, which is excellent).
The truth is, R’s ggplot2 is fantastic. When I first started learning it in 2014, it took me a little while to understand how it works. But once it clicked for me, I just loved it.
Similar to dplyr, ggplot2 is simple, powerful, and easy to use.
Everything just “works.”
In contrast, traditionally, Python’s data visualization toolkits were much worse. Toolkits like matplotlib and others have clumbsy, hard-to-use syntax. And in many cases, default visualizations look like trash.
This has gotten better with some new toolkits like the excellent Seaborn Objects system. But, Seaborn Objects is still not as well-developed as ggplot2.
So for visualization, I still give R the win.
R is better for geospatial visualization
As a side note, R is also better for at least one specialty area of data visualization: geospatial visualization.
For those of you who aren’t familiar with the term … this is essentially map making.
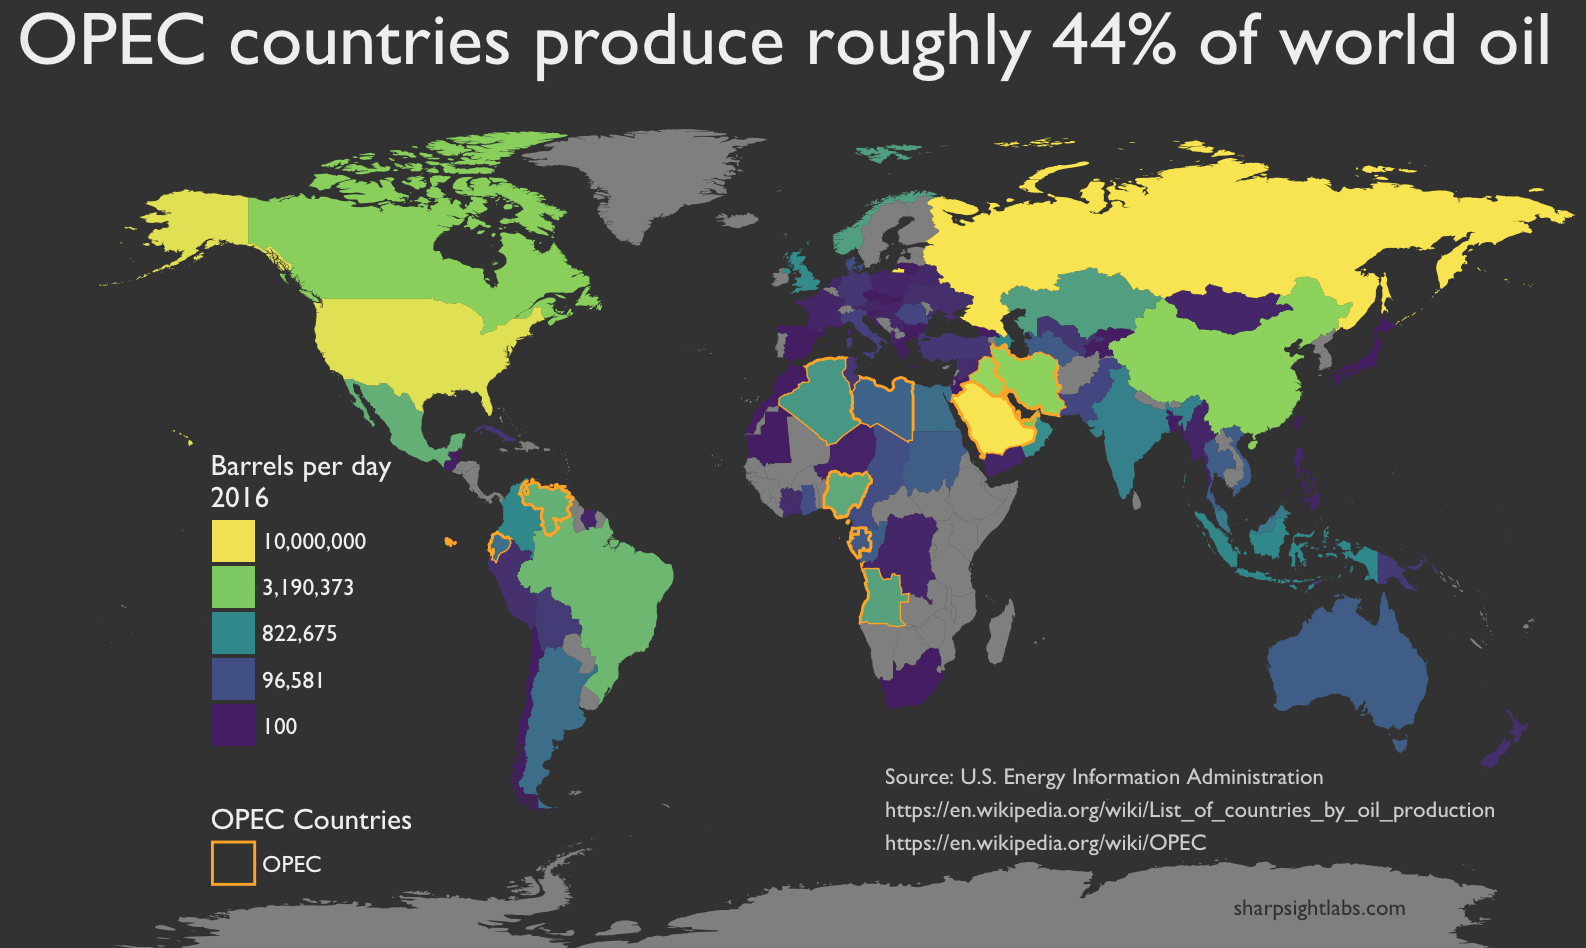
For a few years between about 2015 and 2018, I really went down the rabbit hole on geospatial visualization with ggplot2, and made quite a few maps.
For example, this map of world oil production:
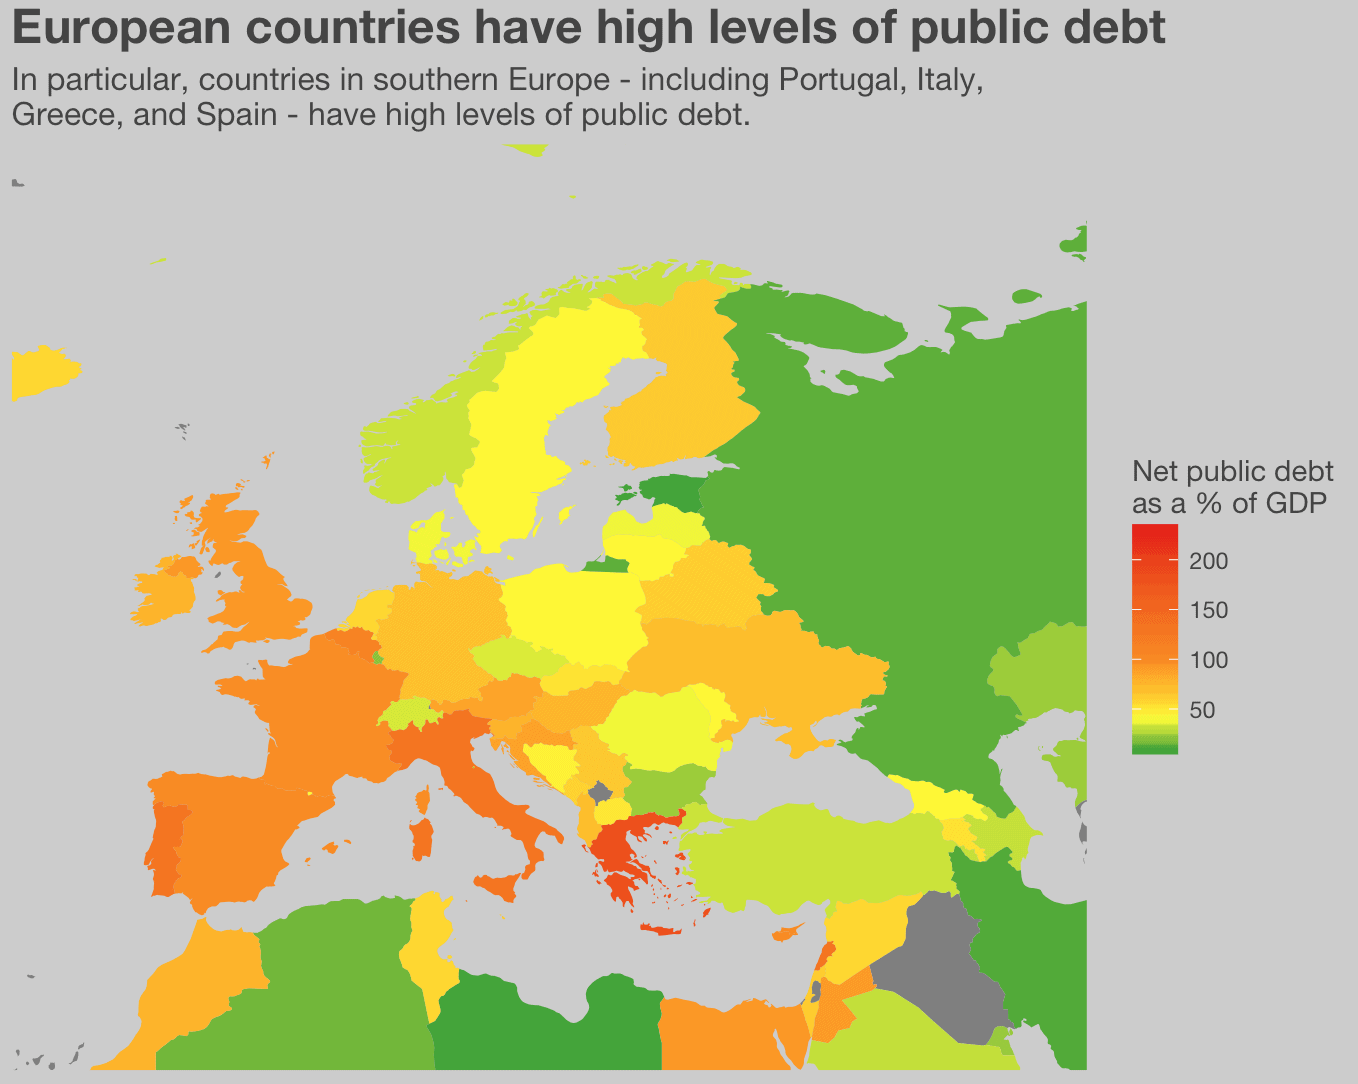
Or this map of European public debt:
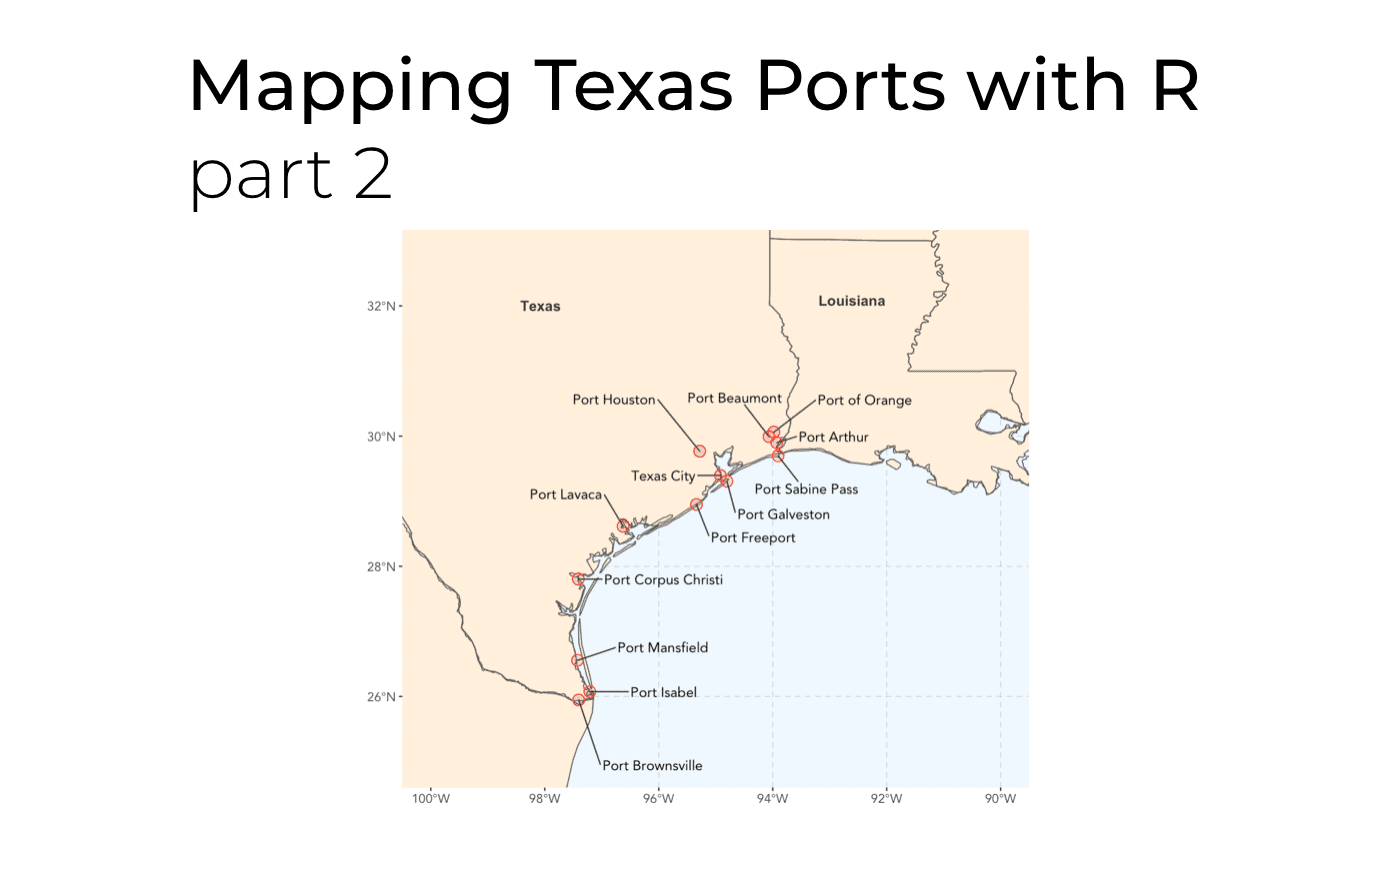
Or this map of Texas ports:
I’ll admit, when I first started doing geospatial work with R, it was a bit of a pain in the ass.
You often had to use very specialized datasets, and perform special transformations on the data to scale the map properly. Around 2014 to 2016, the tools for these tasks were crude and hard to use.
But, the Tidyverse team eventually created new, easy to use toolkits for doing geospatial visualization, namely the sf package. These new toolkits make geospatial visualization much, much easier. Like almost all of the Tidyverse-related packages, they are simple, powerful, and relatively easy to use.
I’ve personally moved away from geospatial visualization in recent years (in favor of ML), but if you’re personally interested in it, then I recommend R’s ggplot2 with the accompanying geospatial packages like sf.
Overall, R is better for “Analytics”
So far in this post, I’ve said that I prefer R’s Tidyverse packages for data wrangling and data visualization.
But data visualization and data manipulation are related to another topic: data analysis.
Long time readers might remember how I think about data analysis:
data analysis = data wrangling + data visualization
It’s perhaps a little more complicated than that, but roughly speaking, it holds true.
So because R’s Tidyverse excels at both data wrangling and data visualization, I also think that it excels at data analytics.
In fact, this is ultimately where I think R shines.
While I currently discourage R/Tidyverse as a full-stack data science language, I do think that it’s great as an analytics language.
What’s the difference?
I’ll eventually write more about the difference between analytics and data science, but at a high level: analytics is mostly about analyzing data to “find insights,” whereas data science expands beyond this to include more advanced topics like machine learning, AI, and data-driven system building.
So if you strictly want to be an analytics professional (and that could be a great job), then R might be the better choice.
Areas Where I Dislike R
I’m not going to go into great detail here, but right now I dislike R for at least 2 things:
- machine learning and AI
- building software or systems
Let’s quickly discuss both of these.
I dislike R for Machine Learning
First, and perhaps most importantly, I dislike R for machine learning.
Now, to be fair, the Tidyverse team has created some Tidyverse compatible ML packages like tidymodels and recipes.
I actually haven’t used them much at all, but by all appearances, they have been designed with the same care and good taste as the other Tidyverse packages. Which is to say, they look great.
But, unfortunately, I haven’t seen them used much at all.
And for better or worse, much of modern machine learning (or at least foundational instruction and prototyping) is done with Python.
If you want to do machine learning, Python and the related ML toolkits are much more important to learn.
I dislike R for Software
I also dislike R for software and system building.
Frankly, this is less of a problem with the R Tidyverse ecosystem, and more of a problem with base R. For as much as I like the Tidyverse, I actually dislike much of traditional “base R.” Writing functions and code with base R always feels clumsy.
For these types of tasks, I prefer Python.
Python’s roots are in software development. So although Python also has strong data science and ML toolkits, it’s also quite good for more traditional software enginneering.
So again: if you want to do any software engineering or system building as a complement to your data science work, then Python is a better choice.
Choose R for Analytics
As noted above, I currently see R as a language for analytics.
If you just want to get, clean, visualize, and analyze data in order to find insights, R/Tidyverse is excellent.
For a broader set of data science tasks or complementary tasks, I think that Python (or even other languages) might be better.
What do you think?
So what do you think?
Do you prefer R/Tidyverse as an analytics language?
Do you like something else?
For what other use cases is R superior?
Leave your comments in the comments section below.
Great clarification, I have a question about reproducible research or data analytics. In R you can produce finished reports or articles by using RMarkDown with analytics code embedded. Can you do the same as easily in Python?
To be honest, I don’t do a lot of R-markdown or reporting with Python … most of my past work has been customized reports and analyses made with a combination of analytics tools and Apple Keynote.
Hi Joshua. This is a very articulate, insightful, and seemingly fair overview/comparison. Nicely done!
Thanks!