In this blog post, I’ll show you how to use the Pandas melt method.
I explain what melt does, how the syntax works, and I’ll show you a simple example.
If you need something specific, you can click on any of the following links:
Table of Contents:
Having said that, this Pandas method is a little difficult to understand, and I recommend that you read the whole post and watch the videos. That will be the best way to really understand what’s going on.
A Quick Introduction to Pandas Melt
We use the Pandas to reshape Pandas dataframes from wide format to long format.
This is a type of data transposition.
And frankly, it’s a little difficult to explain in words.
You kind of need to see it.
Which is why I put together this video, to show you exactly what the Pandas melt method does, and how it works.
As you can see in the video, we use Pandas melt to reorganize the data somewhat.
Melt transforms the names of multiple columns into categorical values of a new categorical variable.
It also transforms the numeric values within those transformed columns into a new “value” variable, that consolidates the numeric values of the original columns into one new column.
It’s hard to describe in words, so if you’re confused, you need to watch the video carefully to actually see what’s happening.
Now … assuming you’ve watched the video …
Does it make better sense now?
Good.
(If not, leave me a question in the comments.)
Let’s take a look at the syntax.
The Syntax of Pandas Melt
The syntax of Pandas melt is a little complicated, because how the function works is a little complicated.
Having said that, I’m going to simplify it as much as possible.
A quick note
One quick note: everything I write here assumes that you’ve imported Pandas and that you have a dataframe that you can use.
melt syntax
Let’s assume that you have a dataframe called myDataFrame.
To use the melt method, you need to type the name of the dataframe, and then type .melt().
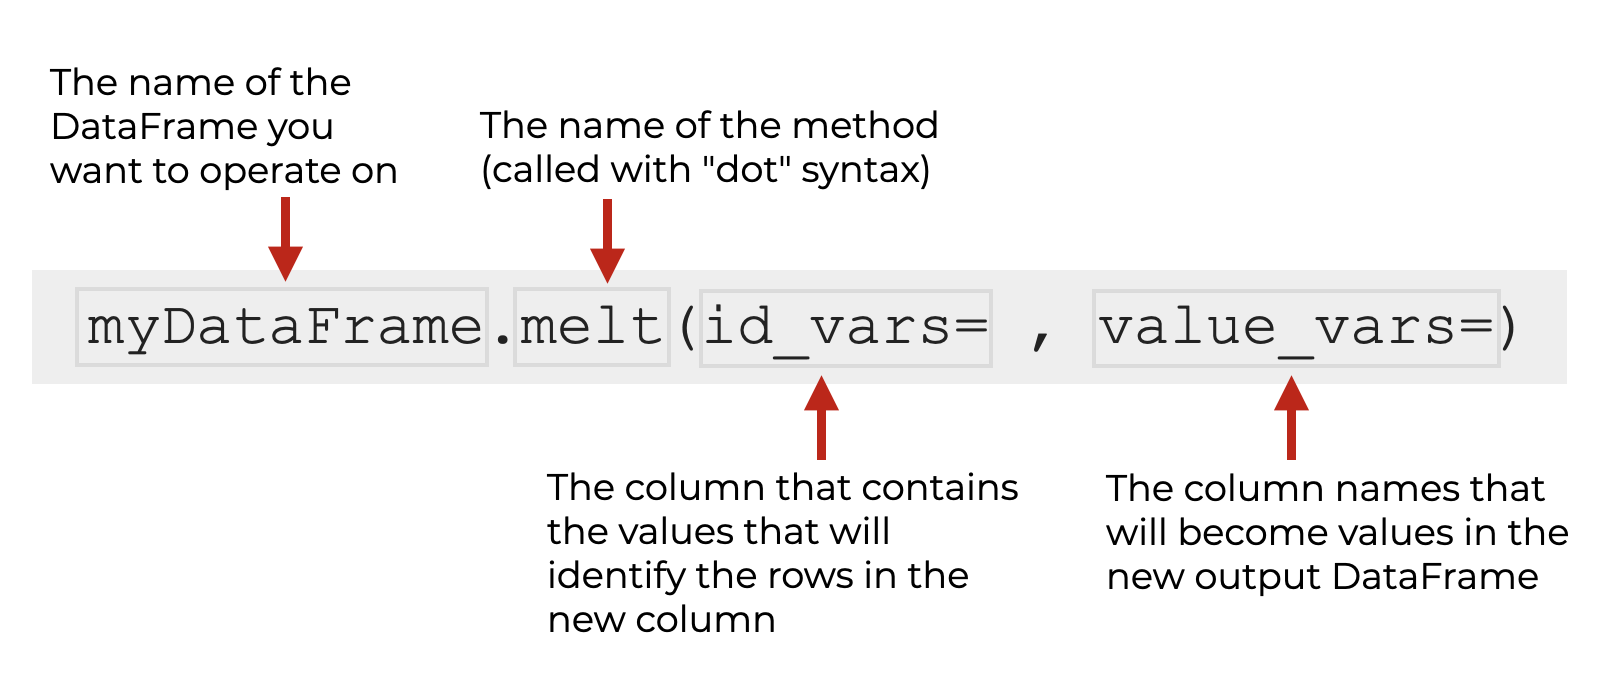
Inside the parenthesis, there are a few critical parameters that you need to use, the most important being id_vars and value_vars.
Let’s take a look at the parameters.
The Parameters of Pandas Melt
The parameters of melt are really what makes it work, so you need to understand them.
The 4 that you should know are:
id_varsvalue_varsvar_namevalue_name
The two most important are id_vars and value_vars, but var_name and value_name are also important.
Let’s take a look at each of these, one at a time.
id_vars (required)
The id_vars parameter specifies the column that contains the values that will identify the rows in the new column.
It’s essentially the column that contains the row identifiers for the output.
The argument to this parameter is the column or group of columns that contain the row identifiers of the new output.
value_vars
The value_vars parameter specifies the columns in the input dataframe that contain the values that will populate the new “value” column in the output DataFrame.
Remember: when we melt our data, there’s a set of existing columns that contain values, and we want to consolidate the values of those multiple columns into a single new “value” column.
And the names of those consolidated columns will become categorical values in a new “variable” column.
The value_vars parameter specifies which existing columns should be transformed into the new output columns.
The argument to this parameter is the names of the columns that contain the values that you want to consolidate.
var_name
The var_name parameter allows you to specify the name of the new “categorical” variable that’s being created from the the names of the “value_vars” columns.
The argument to this parameter is just a text name, formatted as a string.
value_name
The value_name parameter allows you to specify the name of the new “values” variable that’s being created from the the values of the “value_vars” columns.
The argument to this parameter is also just a text name, formatted as a string.
Examples of How to Use Melt
Here, I’ll show you a couple of quick examples of how to use Pandas melt.
Examples:
Run this code first
Run this code first.
It will import Pandas (which you need to already have installed on your machine).
It will also import the data that we’re going to use.
# IMPORT PANDAS
import pandas as pd

# GET DATA
revenue_wide = pd.read_csv('https://learn.sharpsightlabs.com/datasets/pdm/revenue_wide.csv')
EXAMPLE 1: Simple Melt Example
Let’s take a look at a simple example.
Here, we’re going to transpose revenue_wide from wide format to long format.
revenue_wide.melt(id_vars = ['region']
                  ,value_vars = ['Q1','Q2']
                  )
OUT:
          region variable  value
0         Europe       Q1  65000
1  North America       Q1  60000
2         Europe       Q2  62000
3  North America       Q2  63000
Explanation
Take a look at the output.
The “id var” that we used was region. The values of that variable are the row identifiers for the input, and they become part of the unique row identifier in the output (in combination with the new “variable” column).
We used the code value_vars = ['Q1','Q2'] to specify the values we want to transpose were in the columns Q1 and Q2.
Notice that in the output, Q1 and Q2 have become categorical values under the new variable column. And the values that had previously been under the Q1 and Q2 columns of the input, are now values that have been consolidated under the new “value” column of the output.
The output contains the same data as the input, it’s just structured differently, where the names of the old columns Q1 and Q2 have become values of a new categorical variable. And the values of the old columns Q1 and Q2 have become values of a new “value” column.
EXAMPLE 2: Add names to the new variables
Next, we’re going to add names to the newly created variables.
Let’s run the code, and then I’ll explain:
revenue_wide.melt(id_vars = ['region']
                  ,value_vars = ['Q1','Q2']
                  ,value_name = 'revenue'
                  ,var_name = 'quarter'
                  )
OUT:
          region quarter  revenue
0         Europe      Q1    65000
1  North America      Q1    60000
2         Europe      Q2    62000
3  North America      Q2    63000
Explanation
Notice that the structure of the output is the same as the output from example 1.
The only difference from example 1 is that we’ve named the new variables.
We named the new categorical column as quarter with the code var_name = 'quarter'.
And we named the new numerical “value” column as revenue with the code value_name = 'revenue'.
That’s it. If you look closely and follow both examples (examples 1 and 2), you should be able to see what’s going on here.
Leave your other questions in the comments below
All of that said, I do realize that Pandas melt is a difficult tool to understand.
So, is there something you’re still confused about?
Do you have questions?
I want to hear from you.
Leave your questions and comments in the comments section at the bottom of the page.
For More Python Data Science Tutorials, Sign Up for our Email List
If you want more FREE tutorials about Pandas, and Python data science, then sign up for our email list
We publish new free tutorials every week on things like:
- NumPy
- Pandas
- Base Python
- Scikit learn
- Machine learning
- Deep learning
- … and more.
When you sign up for our email list, we’ll send our free tutorials directly to your inbox.