This tutorial will explain how to use the Pandas value_counts method to count the values in a Python dataframe.
It explains what value_counts does, how the syntax works, and it provides step-by-step examples.
If you need something specific, you can click on any of the following links.
Table of Contents:
Ok. Let’s get into the details.
A quick introduction to the Pandas value_counts method
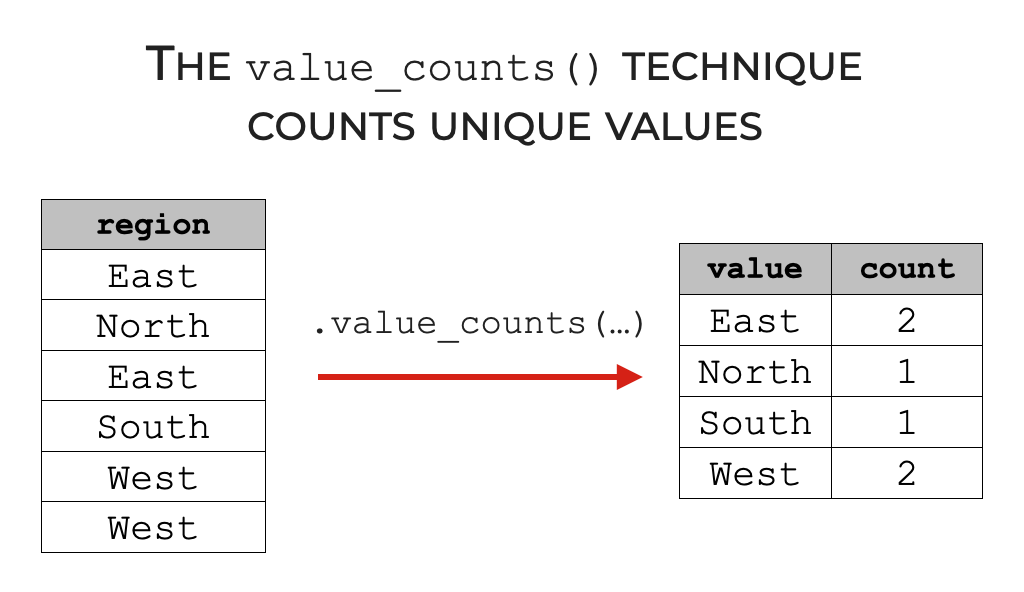
First, let’s just start with an explanation of what the value_counts technique does.
Essentially, value_counts counts the unique values of a Pandas object. We often use this technique to do data wrangling and data exploration in Python.
The value_counts method will actually work on several different types of Pandas objects:
- Pandas Series
- Pandas dataframes
- dataframe columns (which are actually Pandas Series objects)
Having said that, how you use the value_counts method will vary slightly depending on which type of object you’re operating on.
Additionally, there are some optional parameters that you can use that will change what value_counts does.
That being the case, let’s look at the syntax.
The syntax of value_counts
Ok. Let’s look at the syntax of the Pandas value_counts technique.
Here, I’ll divide this up into different sections, so we can look at the syntax for how to use value_counts on Series objects and how to use value counts on dataframes.
A quick note
The following syntax explanations assume that you’ve imported Pandas, and that you’ve already created a Pandas dataframe or a Pandas series.
You can import Pandas with this code:
import pandas as pd
And for more information about dataframes, you can read our introduction to Pandas dataframes.
syntax to use value_counts on a Pandas dataframe
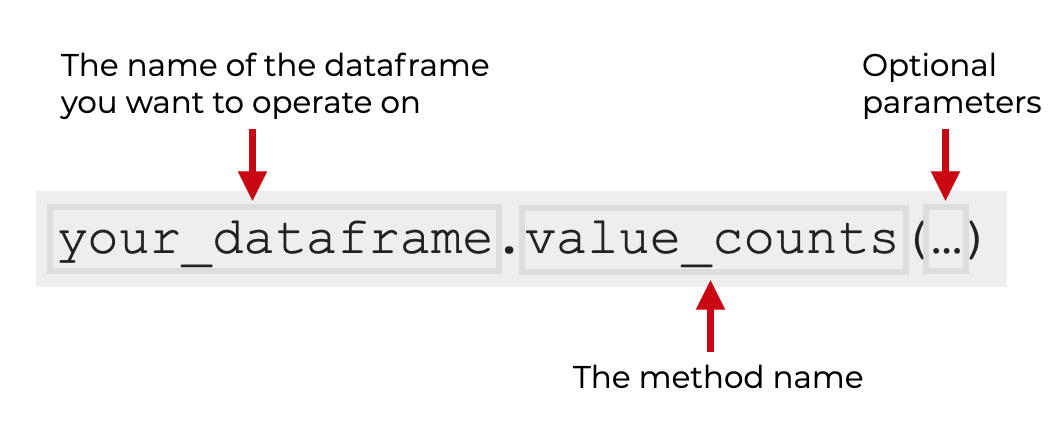
First, let’s look at the syntax for how to use value_counts on a dataframe.
This is really simple. You just type the name of the dataframe then .value_counts().
When you use value_counts on a dataframe, it will count the number of records for every combination of unique values for every column.
This may be more information than you want, and it may be better to subset the dataframe down to only a few columns. I’ll show you some examples of this in the examples section.
Additionally, there are some optional parameters that you can use, which will modify the behavior of the method. I’ll show you those in the parameters section.
syntax to use value_counts on a Pandas Series
Next, let’s look at the syntax to use value_counts on a Series object.
The syntax for a Series is almost the same as the syntax for a dataframe:
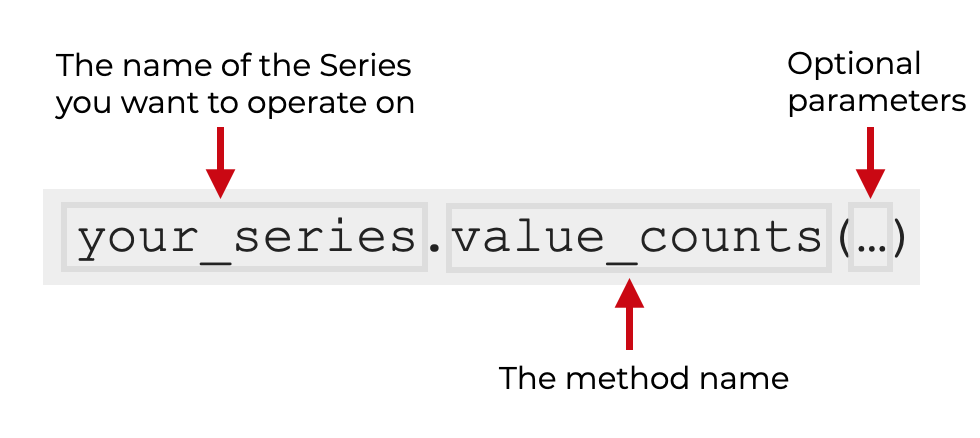
You simply type the name of the Series object, and then .value_counts().
Additionally, there are some optional parameters that you can use, which we’ll discuss in the parameters section.
syntax to use value_counts on a dataframe column
Finally, let’ look at how to use value_counts on a column inside of a dataframe.
Remember: individual dataframe columns are Series objects.
So to call value_counts on a column, we first use “dot syntax” to retrieve an individual column. For example, if your dataframe is named your_dataframe and the column you want to retrieve is called column, you would start by typing your_dataframe.column.
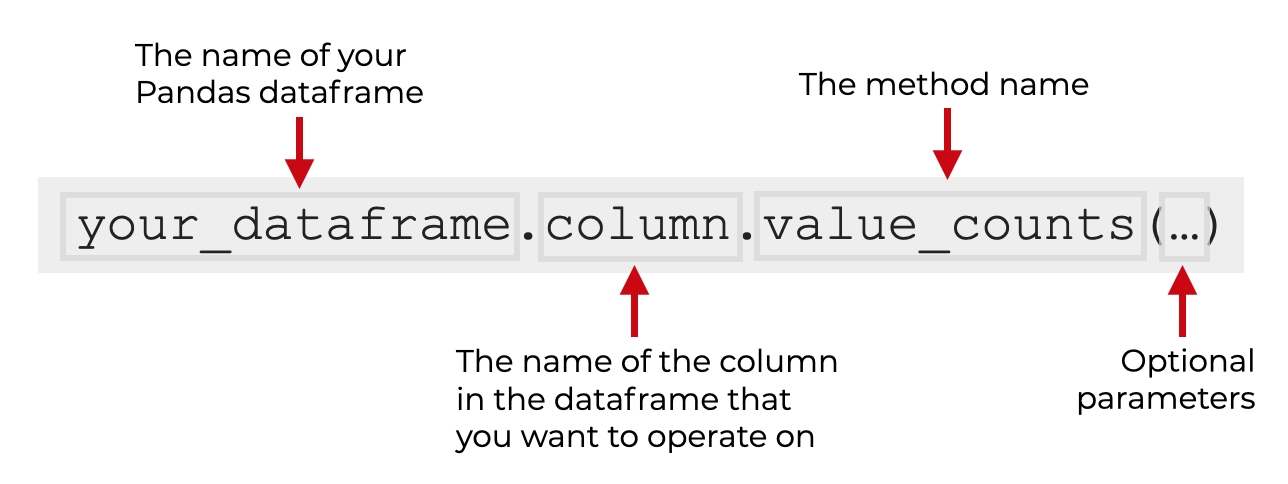
After that, you simply type .value_counts() and the method will retrieve the count of the unique values for that individual column.
And once again, there are some additional parameters that you can use to change how value_counts works.
Let’s look at those parameters.
The parameters of value counts
The Pandas value_counts technique has several parameters that you can use which will change how the technique works and what exactly it does.
ascendingsortnormalizesubsetdropna
In addition, there is the bins parameter, which I rarely use and won’t discuss here.
It’s important to note that all of these parameters are optional.
It’s also important to note that most of these parameters – ascending, sort, and normalize – are used for both the Series syntax and the dataframe syntax.
On the other hand, subset is only available when you use value_counts on dataframes, and dropna is only available when you use value_counts on Series.
Having said all of that, let’s look at each of these parameters individually.
ascending
By default, value_counts will sort the data by numeric count in descending order.
The ascending parameter enables you to change this.
When you set ascending = True, value counts will sort the data by count from low to high (i.e., ascending order).
I’ll show you an example of this in example 4.
sort
The sort parameter controls how the output is sorted.
By default, value_counts sorts the data by the numeric count.
You can change this and sort the data by categories instead by setting sort = False.
I’ll show you an example of this in example 5.
normalize
The normalize parameter changes the form of the output.
By default, value_counts shows the count of the unique values.
But if you set normalize = True, value_counts will display the proportion of total records instead of the raw count.
I’ll show you an example of this in example 6.
subset
The subset parameter enables you to specify a subset of columns on which to apply value_counts, when you use value_counts on a dataframe.
The argument to this parameter should be a list (or list-like object) of column names.
So for example, if you want to use value counts on var_1 and var_2 in a dataframe, you would use the code your_dataframe.value_counts(subset = ['val_1','var_2']).
NOTE: again, this parameter is works when you use value_counts on a whole dataframe.
I’ll show you an example of this in example 7.
dropna
The dropna parameter enables you to show ‘NA’ values (i.e., NaN values).
You can do this by setting dropna = False.
NOTE: this parameter is only available for Pandas Series objects and individual dataframe columns. This parameter will not work if you use value_counts on a whole dataframe.
I’ll show you an example of this in example 2.
Examples: Get Value Counts for Pandas Dataframes and Series Objects
Now that we’ve looked at the syntax, let’s look at some examples of how to use the value_counts technique.
Examples:
- Use value_counts on a dataframe column
- Include ‘NA’ values in the counts
- Use value_counts on an entire Pandas dataframe
- Sort the output in ascending order
- Sort by category (instead of count)
- Compute proportions (i.e., normalize the value counts)
- Operate on a subset of dataframe columns
Run this code first
Before you run the examples, you’ll need to run some preliminary code in order to:
- import necessary packages
- get a dataframe
- create a dataframe subset that we can work with
Let’s do those one at a time.
Import Packages
First, let’s import two packages that we’ll need.
Specifically, we’ll need to import Pandas and Seaborn.
You can do that with the following code:
import pandas as pd
import seaborn as sns
Obviously, we’ll need Pandas to use the value_counts() technique. But we’ll also need Seaborn, because we’ll be using the titanic dataframe which we can load from Seaborn’s pre-installed datasets.
Get dataframe
Next, let’s get the dataframe we’ll be working with.
In the following examples, we’ll be using the titanic dataset, or some subset of it.
So here, let’s load the dataset from Seaborn:
# GET DATASET
titanic = sns.load_dataset('titanic')
Additionally, let’s print it out, so we can see the contents:
print(titanic)
OUT:
     survived  pclass     sex   age  sibsp  parch     fare embarked   class       who  adult_male deck  embark_town alive  alone
0           0       3    male  22.0      1      0   7.2500        S   Third      man        True  NaN  Southampton    no  False
1           1       1  female  38.0      1      0  71.2833        C   First    woman       False    C    Cherbourg   yes  False
2           1       3  female  26.0      0      0   7.9250        S   Third    woman       False  NaN  Southampton   yes   True
3           1       1  female  35.0      1      0  53.1000        S   First    woman       False    C  Southampton   yes  False
4           0       3    male  35.0      0      0   8.0500        S   Third      man        True  NaN  Southampton    no   True
..        ...     ...     ...   ...    ...    ...      ...      ...     ...      ...         ...  ...          ...   ...    ...
886         0       2    male  27.0      0      0  13.0000        S  Second      man        True  NaN  Southampton    no   True
887         1       1  female  19.0      0      0  30.0000        S   First    woman       False    B  Southampton   yes   True
888         0       3  female   NaN      1      2  23.4500        S   Third    woman       False  NaN  Southampton    no  False
889         1       1    male  26.0      0      0  30.0000        C   First      man        True    C    Cherbourg   yes   True
890         0       3    male  32.0      0      0   7.7500        Q   Third      man        True  NaN   Queenstown    no   True

[891 rows x 15 columns]
There are 15 columns in this dataframe, which will be a little difficult to work with if we’re using the value_counts() technique.
That said, let’s quickly create a subset that we can use with some of our examples.
Create Dataframe Subset
Now, let’s create a subset of the titanic dataframe.
Here, we’ll create a subset that contains two variables: sex and embarked.
To subset down to these two variables, we’ll use the Pandas filter method:
#CREATE SUBSET
titanic_subset = titanic.filter(['sex','embarked'])
For some of our examples, this subset will simply be easier to work with, since it has only 2 variables.
EXAMPLE 1: Use value_counts on a dataframe column
First, let’s use the value_counts technique on a single column.
Here, we’ll use value_counts on the embarked variable in the titanic dataframe.
Let’s run the code, and then I’ll explain:
titanic.embarked.value_counts()
OUT:
S    644
C    168
Q     77
Name: embarked, dtype: int64
Explanation
The code to perform this operation is a single line of code, but in some sense, it’s a two step process.
In this code, we’re:
- retrieving the
embarkedvariable with “dot syntax” - calling the
value_counts()method
So, we’re retrieving the embarked variable with the code titanic.embarked.
But after that, we’re calling the value counts method with .value_counts().
In the output, you see the unique values of the embarked variable – S, C, and Q – and the counts associated with each of those values.
EXAMPLE 2: Include ‘NA’ values in the counts (Series only)
Next, let’s include the ‘NA’ values (i.e., NaN) in the output. This will enable us to see the number of ‘missing’ values for the variable, if there are any.
Keep in mind that here, we’re still going to operate on a single dataframe variable.
titanic.embarked.value_counts(dropna = False)
OUT:
S      644
C      168
Q       77
NaN      2
Name: embarked, dtype: int64
Explanation
Here, we’ve called value_counts() just like we did in example 1.
The only difference is that we included the code dropna = False inside the parenthesis.
As you can see in the output, there is now a count of the number of NaN values (i.e., “missing” values).
This can be useful if you need to identify missing values to clean them up, etc.
NOTE: This will only work if you use value_counts() on a Pandas Series or a dataframe column. It will not work if you try to use value_counts on an entire Pandas dataframe (like in example 3).
EXAMPLE 3: Use value_counts on an entire Pandas dataframe
In the last two examples, we used value_counts on a single column of a dataframe (i.e., a Pandas series object).
Now, let’s use value_counts on a whole dataframe.
Here, we’re going to use value counts on the titanic_subset dataframe. (Remember, we created this subset earlier. It has only two variables to make it easier to work with.)
Ok. Let’s run the code:
titanic_subset.value_counts()
OUT:
sex     embarked
male    S           441
female  S           203
male    C            95
female  C            73
male    Q            41
female  Q            36
dtype: int64
Explanation
This is really straight forward.
To do this, we simply typed the name of the dataframe, and then .value_counts().
You can see that the output is a count of the unique combinations of the variables in the dataframe.
Notice as well that the output is sorted in descending order. That’s the default, but we can change it as well, which we’ll do in the next example.
EXAMPLE 4: Sort the output in ascending order
In this example, we’ll sort the output in ascending order.
Remember that by default, value_counts sorts the output in descending order.
We can change that behavior though with the ascending parameter.
Let’s take a look:
titanic_subset.value_counts(ascending = True)
OUT:
sex     embarked
female  Q            36
male    Q            41
female  C            73
male    C            95
female  S           203
male    S           441
dtype: int64
Explanation
Here, we see the counts of the unique combinations of values in the dataframe.
But now, because we set ascending = True, the output is sorted in ascending order … it’s sorted from low to high.
EXAMPLE 5: Sort by category (instead of count)
Now, let’s remove the sorting altogether.
To do this, we’ll call the method with sort = False.
titanic_subset.value_counts(sort = False)
OUT:
sex     embarked
female  C            73
        Q            36
        S           203
male    C            95
        Q            41
        S           441
dtype: int64
Explanation
Notice in the output, the data are not sorted by the value counts (i.e., the numbers).
Instead, the data are sorted by the categories. The unique categorical values in both variables are sorted in alphabetical order.
Personally, I think this is easier to read, but it does depend on what you’re doing.
There may be some applications where this is better, and there may be some instances where it’s better to sort the data by the numeric counts (like the default behavior).
In any case, you have a choice.
EXAMPLE 6: Compute proportions (i.e., normalize the value counts)
In this example, let’s compute the proportions of each unique combination of values.
In the previous examples, value_counts provided a count of the number of values.
Here, we’ll tell value_counts to compute the percent of total records, using the normalize parameter:
titanic_subset.value_counts(normalize = True)
OUT:
sex     embarked
male    S           0.496063
female  S           0.228346
male    C           0.106862
female  C           0.082115
male    Q           0.046119
female  Q           0.040495
dtype: float64
Explanation
The output here is somewhat similar to the output for example 3, in the sense that it’s sorted in descending order of frequency.
But instead of showing the raw counts of each unique combination of categories, it’s showing the proportion. Notice that if you add all the numbers up, they add up to 1.
So again, the numbers represent the proportion of total records accounted for by each unique combination.
EXAMPLE 7: Operate on a subset of dataframe columns (dataframes only)
In the previous examples, I’ve shown you how to use value_counts on a pandas Series, a small Pandas dataframe (with only 2 columns), or a single dataframe column.
Here, I’ll show you how to operate a large dataframe with many columns.
But we’ll use the subset parameter to reduce the size and complexity of the output.
So here, we’ll be working with the full titanic dataframe, which has 15 columns. We’ll use the subset parameter to operate only on two of those variables: sex and embarked.
Let’s take a look.
titanic.value_counts(subset = ['sex','embarked'])
OUT:
sex     embarked
male    S           441
female  S           203
male    C            95
female  C            73
male    Q            41
female  Q            36
dtype: int64
Explanation
Here, we’re working with the full titanic dataset. Remember: this is the full dataset with 15 variables (instead of the smaller titanic_subset dataframe, which only has 2 variables).
So here, we’re taking the full titanic dataframe with 15 variables and using value_counts on only 2 variables. To do this, we’re setting subset = ['sex','embarked'].
Notice that syntactically, each variable we want to include is presented as a string (inside of quotation marks). And the collection of variable names is organized into a Python list.
Frequently asked questions about value_counts
Now that you’ve learned about value_counts and seen some examples, let’s review some frequently asked questions.
Frequently asked questions:
Question 1: Can you use the dropna parameter when you operate on a dataframe?
Unfortunately, no.
The dropna parameter is very useful for identifying missing values, but unfortunately, you can only use this parameter when you operate on a single dataframe column or Pandas series.
Leave your other questions in the comments below
Do you have any other questions about the Pandas value_counts technique?
Is there something that you’re struggling with that I haven’t covered here?
If so, leave your question in the comments section below.
To learn more about Pandas, sign up for our email list
This tutorial should have helped you understand the value_counts technique, and how it works.
But if you want to master data cleaning and data wrangling with Pandas, there’s a lot more to learn.
And there’s even more to learn if you want to learn data science in Python, more broadly.
That said, if you’re ready to learn more about Pandas and data science in Python, then sign up for our email list.
When you sign up, you’ll get free tutorials on:
- NumPy
- Pandas
- Base Python
- Scikit learn
- Machine learning
- Deep learning
- … and more.
We publish free data science tutorials every week. When you sign up for our email list, we’ll deliver these free tutorials directly to your inbox.
Nice page! I am trying to assign a column.value_countrs.assigned (how many times it shows up inside the column), it works and i get an output of ten, but when i try to convert it to html using self.assigned = assigned.to_dict(), i am getting an error AttributeError: ‘numpy.float64’ object has no attribute ‘to_dict’
is there a way around this?