One of the most common questions I get from data science students is “should I learn R or Python?”
In the last year or so, many of the blog posts at the Sharp Sight blog have been Python data science tutorials, and I’ve actually been using Python a lot myself.
But recently, since I began the R data analysis series for covid19 data, I started to remember just how much I love analyzing data with R, and why.
Why I love R, and why you should learn it
The fact is, even though Python is also excellent in particular areas, I still really love R.
R particularly shines in a few key areas. I want to discuss those somewhat, so you understand where R is strong and why you should learn it.
Areas where R is the best
There are really three key areas where R shines:
- data wrangling
- data visualization
- data analysis
data wrangling
Let’s start with data manipulation.
For data manipulation, R is slightly better than Python. Not by much, but a little.
R’s dplyr package and related packages (like tidyr, lubridate, stringr, forcats, etc) make data manipulation extremely easy in R.
Everything “just works”.
The functions are well named, so you can remember the names of the functions. All of the functions are also highly modular. They do one thing and one thing only. So when you need to subset your rows, there’s a simple function to use (the dplyr filter function). When you want to subset your columns, there’s another simple function (the select function). Etcetera.
In R and the Tidyverse, everything is highly modular and everything fits together like little building blocks.
Honestly, data wrangling is just so easy with dplyr.
Python’s Pandas package is also good, and almost as good as dplyr. I think the thing that’s really lacking is that Pandas sometimes lacks helper functions that do very specific data manipulation tasks. So sometimes, you need to figure out a workaround for something very specific.
Another way of saying this is that dplyr and R’s tidyverse have a function for 99% of the data manipulation tasks that you’ll need to do, whereas Pandas has a function for 95%.
Pandas is great, but R, dplyr, and the Tidyverse have a slight edge for data manipulation.
Data visualization
For data visualization (at least, static data visualizations) R’s ggplot2 is substantially better than anything for Python. Matplotlib is powerful, but the syntax is complicated and hard to use. Seaborn is easier to use, but it lacks the polish of ggplot2.
When I visualize data with ggplot2, everything “just works.
Let me give you an example.
Recently for our R covid19 series, I created a small multiple chart:
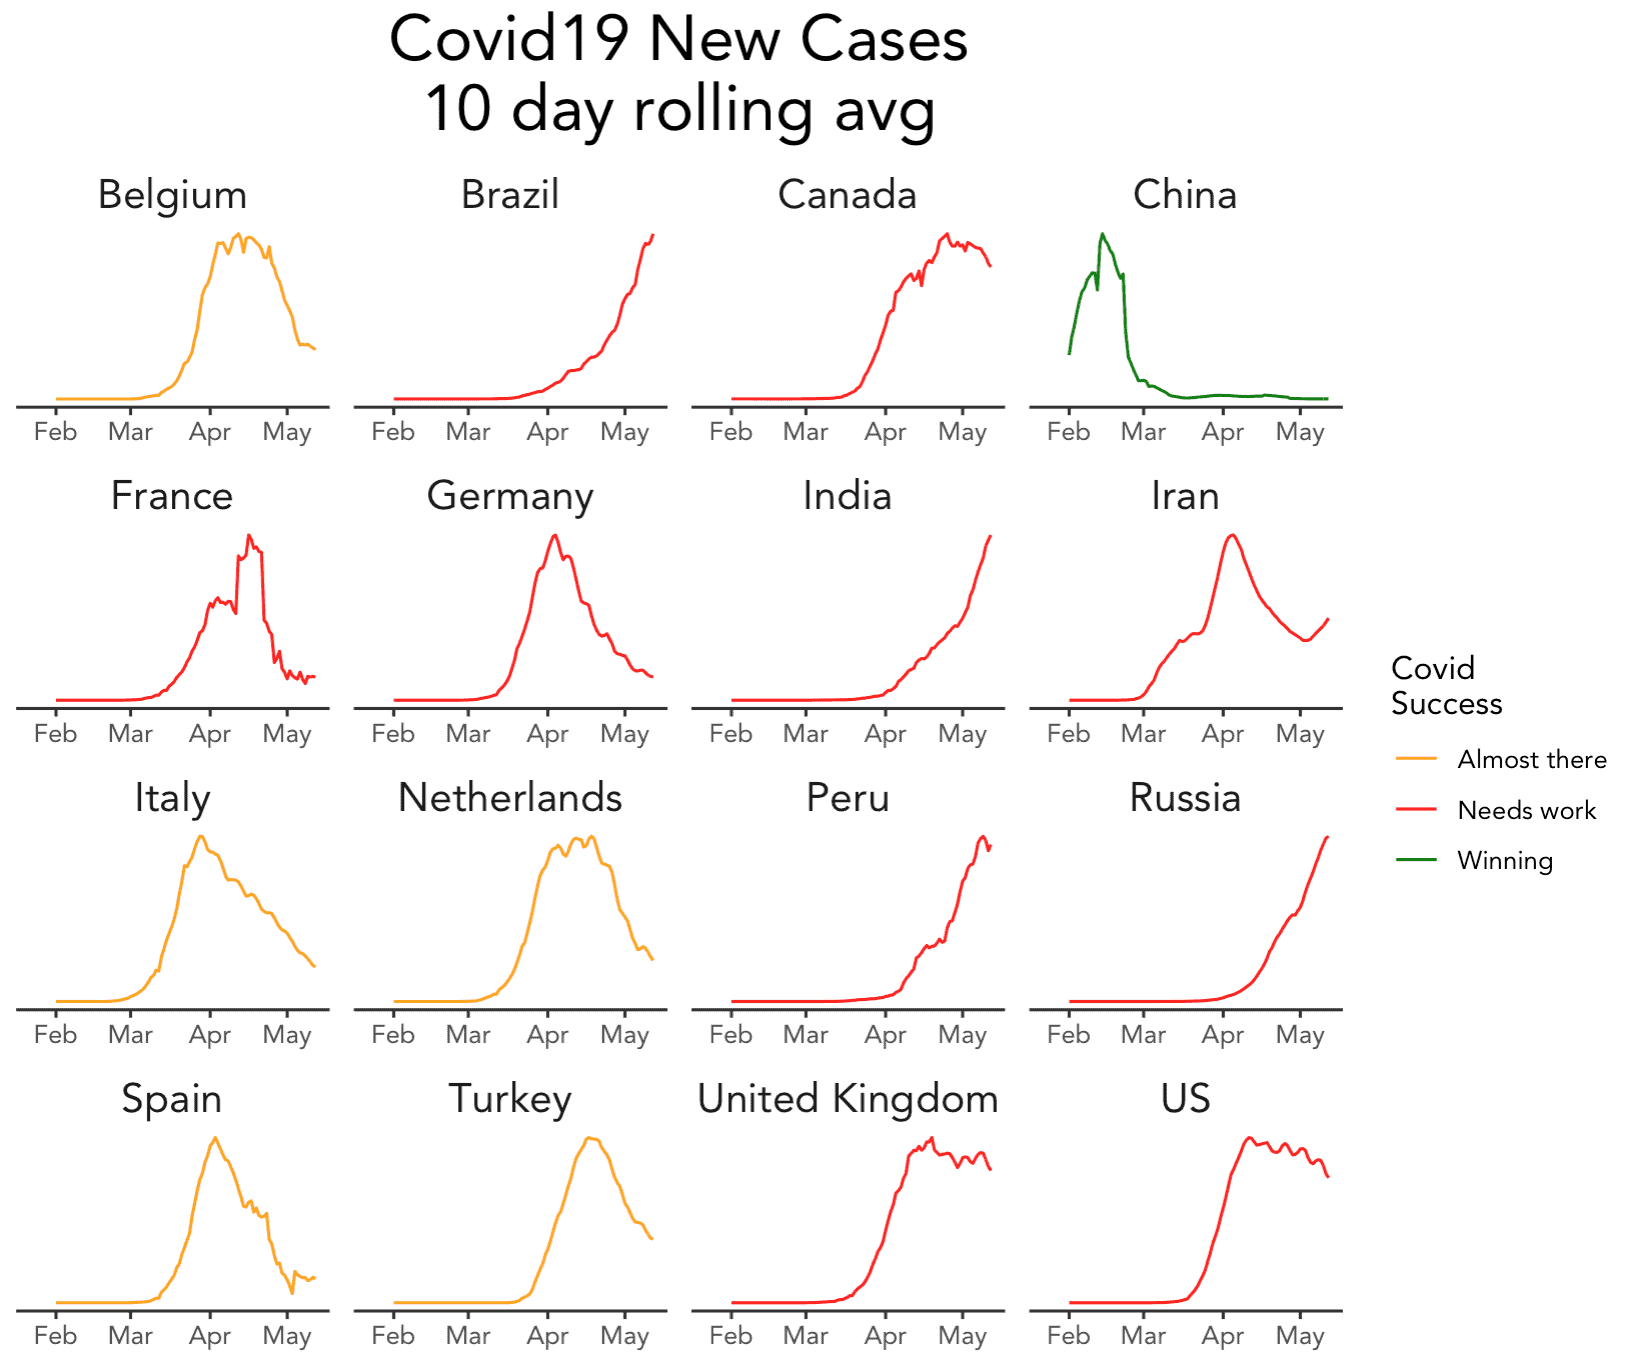
Long time readers at the Sharp Sight blog know that I really love small multiple charts. As a data scientist, the small multiple chart should be one of the most powerful data visualization techniques in your toolkit.
But the fact is, small multiple charts are hard to create in most languages.
In Python, you can technically create one with Matplotlib or Seaborn.
But having said that, small multiples are a little harder to create with Seaborn. Can you create one? Yes. But formatting small multiple charts is a little cumbersome with Seaborn. Some of the code to format small multiples in Seaborn is a little buggy, so you have to resort to for-loops that manually modify low level chart properties. Frankly, it’s a pain in the ass.
And god … don’t get me started on matplotlib. Matplotlib is so much more complicated compared to modern data visualization tools.
One of the motto’s for Matplotlib is that “Matplotlib makes easy things easy and hard things possible.”
With due respect to the creator’s of Matplotlib, that’s kind of BS.
Matplotlib makes hard things possible. True. You can create almost any visualization with Matplotlib. But it’s always hard, compared to ggplot2.
In matplotlib, the easy things are kind of hard. The hard things are really hard. If you want to spend your afternoon writing for-loops to visualize things that would take you 5 minutes in ggplot2, go right ahead.
The fact is, compared to almost anything in Python, ggplot2 is just. so. easy.
Dare I say, ggplot2 is a joy to use. (Ok. I said it.)
That’s not to say that ggplot2 is never a pain in the ass. It is. Sometimes. But usually, the hard things about ggplot2 are polishing a visualization up. The last 5 to 10 percent where you’re trying to take a chart from “rough draft” to “perfect” is the hard part. With ggplot2, the challenge is more about the process than the programming.
I’ll say it again: without question, my favorite data visualization toolkit is ggplot2, and to use it properly, you need to use R.
Data analysis
Data analysis is important. Very important. Quite possibly, the most important data science skill.
It’s a little more complicated than that, because data analysis ultimately breaks down to data wrangling and data visualization. That is, data analysis is mostly data wrangling and data visualization, applied in particular ways with a particular process, and particular objectives. (So if data analysis is really important, you really need to learn data wrangling an data visualization first.)
Setting aside the nuance, I need to emphasize how important data analysis is to data science or “data analytics” more broadly.
No matter what project you’re working on, you need to analyze your data.
Doing machine learning? Great. Before you get started, you need to explore your data with exploratory data analysis.
Do you have a machine learning model that you’ve finished training? Ok then. You need to analyze the performance of the model and use analysis techniques to diagnose possible problems.
The same thing for “finding insights” When you look at most job descriptions for data-related jobs, you’ll find that they almost always use the term “find insights.” Recruiters and hiring managers want you to be able to “find insights in data.”
What does that mean?
They want you to be able to analyze data and find things that will increase profits, cash flows, and shareholder value. At the end of the day, they’re really just talking about using data analysis to drive profitability and financial metrics.
Remember what I said though: data analysis is mostly just an application of data wrangling and data visualization, with a particular process.
To analyze data (i.e., to “find insights”), you need to subset, aggregate, and compute summary statistics. You need to use data wrangling.
You also need to “see” the important things. You need to almost literally “see” the valuable things in the data. (And you need to be able to communicate those findings to others.)
To see those insights yourself, you need to use data visualization. To communicate them to others, you commonly use visualizations like bar charts, line charts, scatterplots, and other visualizations.
What I’m emphasizing is that data analysis – whether for a machine learning project or data exploration, or reporting – is important, and it’s really just about using data wrangling and data visualization in particular ways.
But recall what I wrote earlier in this blog post: for data wrangling, R is slightly better than Python. And for data visualization, R’s ggplot2 is quite a bit better than Python.
What I’m driving at, is that because R is better at data wrangling and data visualization, it is also a superior tool for data analysis.
In sum: if I personally need to analyze a new dataset, I’d rather do it with R than Python.
Where R is not the best
As I just discussed, R is great a lot of things. It’s almost certainly the best for producing static, non-interactive data visualizations. It’s marginally better than Python at data manipulation. And because of these things, R is arguably the best programming language for data analysis as well.
But R is not necessarily the best at everything.
For example, I really don’t like traditional “programming” with R. What I mean is, I don’t like doing traditional programming tasks like writing functions, loops, flow control syntax, etc. You need to do these things with old-school “Base R” instead of the Tidyverse. For the most part, I just don’t like how we have to do them in base R.
There are plenty of die-hard R programmers that will disagree with me, so this (like many of the things in this post) are sort of a matter of opinion. But I think that many people will agree: for any kind of traditional programming, Python is great. Arguably the best, in terms of simplicty and ease of use.
Ultimately, if I have to do any kind of programming besides data analysis scripts, I prefer Python over R.
There’s also machine learning. Right now, Python has a better ecosystem for building machine learning models, namely, sci-kit learn. Sci-kit learn has a large, rich set of tools for building ML models. It also has a large ecosystem of people and companies that use it. In Silicon Valley, you frequently hear about people building ML systems with Python, sci-kit learn and other ML packages. You rarely hear people talk about building ML systems with R.
To be fair, R does have some machine learning packages as well. Historically, there was the caret package. More recently, there is the tidymodels package which is much more streamlined than past ML toolkits for R. In some sense tidymodels works for machine learning how ggplot works for data visualization.
I suspect that tidymodels will become more popular, but as of right now, it’s not as popular as Python’s sci-kit learn.
Why you should probably learn both (eventually)
Like it or not, there is not “One Language to Rule Them All” in the data science world.
Neither R or Python (or any of the other options) of the programming languages is the best at everything.
For the most part, if I want to build a system or build “software”, then I’ll reach for Python.
If I want to do machine learning, Python is probably better (although R is upping it’s game in this area with the tidymodels package and related packages).
But if I want to do data analysis, data visualization, or reporting, R has the better toolkit. That’s definitely true if I need to do any data visualization
Like it or not, there are two primary data science languages, and they each have strengths and weaknesses.
It sucks that there’s not one language, but that’s the reality.
Eventually, if you want to be a great data scientist, you should probably learn both.
So which should you learn first?
So which should you learn first?
It depends.
As fitness guru Robb Wolf likes to ask: “Who are you and what are your goals?”
If you are dead set on becoming a machine learning engineer, I’d say that you should learn Python.
If you want to do traditional software engineering along side your data work, you should probably pick Python.
But if you want to do data analysis and “analytics,” I’d actually recommend R.
One thing to remember here is that there are a lot more data analysis jobs and “analytics” jobs than there are “machine learning engineering” jobs.
Thousands of companies need people to do data analysis. There is a lot of need for people who can “find insights in data.” If that’s what I need to do, then R is the toolkit.
One other advantage about R is that (as I noted above) the syntax for doing analytics tasks is just a little easer to learn, remember, and master.
What that means is that with R, you spend less time focussing on trying to get the syntax to work, and more time focussing on application. This enables you to learn the deeper principles of visualization and analysis faster.
What do you think? Which do you prefer?
In any case, I think both Python and R are great, but R has some distinct advantages in some areas and for some use cases.
Which do you prefer?
And what questions do you have about R vs Python?
Leave a question in the comments section below.
To learn how to do this, master data visualization
As I mentioned in this tutorial, I love R and I think that most serious data science students should learn it.
If you’re ready to master data science in R and master ggplot2, dplyr, and the rest of the Tidyverse, you should join our course Starting Data Science with R. Starting Data Science is our premium course to help you master the essential tools of R data science as fast as possible.
We’re reopening the course for enrollment on Tuesday May 19, and if you want to get the enrollment email, make sure to sign up for our email list.
Only people who are on our email list are notified when we open enrollment for our courses!
Great article. For a number of reasons I have become “okay” in both. And have always wondered whether I should just focus on one. But I really do agree with your summary. In fact, you summed up what I’ve thought as well just never put it into such precise words. Thanks.
Good to hear that you liked it.
I definitely recommend that you focus on one first, then the other.
Trying to do both at the same time will just confuse you. They are certainly different languages, but somewhat similar in some ways. For example, Pandas and dplyr both have a
filter()tool that do different things. Same name, different functionality. It’ll mess you up and make them hard to learn.Both good languages though and as noted in the article, they both have their own use cases.
Regarding your statement:
there are a lot more data analysis jobs and “analytics” jobs than there are “machine learning engineering” jobs
Can you please show some examples? I spend 3 years + learning data science and finally settle down with R Tidyverse. Along the journey, I notice most job posting are about “Machine Learning”, even for a data analyst position.
However, myself enjoy doing Analytics more than Machine Learning. To some extent, I am pretty disappointed that my analytics skill isn’t as valuable as Machine Learning.
Good insights. R also has a good eco system (barring scikit equivalent) modules like H2O, Keras and SparkML. Since, I use both Python and R, wont take a hard stance of chosing one side. Like you mentioned, both are needed eventually.
Yeah, agreed. R has some decent ML toolkits and it’s getting better.
The broader point is about the people, etc. There are more people doing ML with Python and more projects, both from individuals and companies.
I’m optimistic that R will increase it’s ML profile, but for right now, Python has the lead for machine learning.