How much data science do you actually remember?

How many data science books have you read? 5? 10? A few dozen? How many free online courses have you taken? A few? How many blog posts have you read? (I’d be willing to bet: you’ve read dozens.) If you’re like most budding data scientists, you’ve probably consumed a lot of material. You probably even … Read more
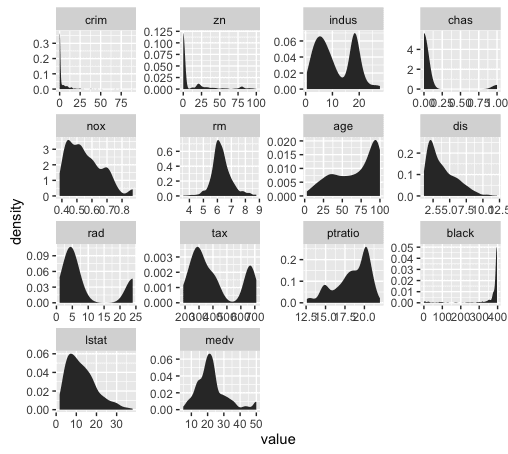
How to use data analysis for machine learning (example, part 1)

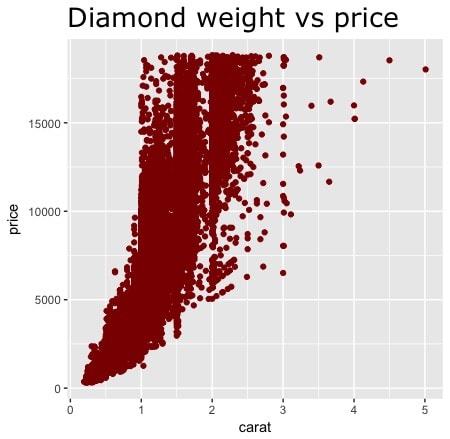
In my last article, I stated that for practitioners (as opposed to theorists), the real prerequisite for machine learning is data analysis, not math. One of the main reasons for making this statement, is that data scientists spend an inordinate amount of time on data analysis. The traditional statement is that data scientists “spend 80% … Read more

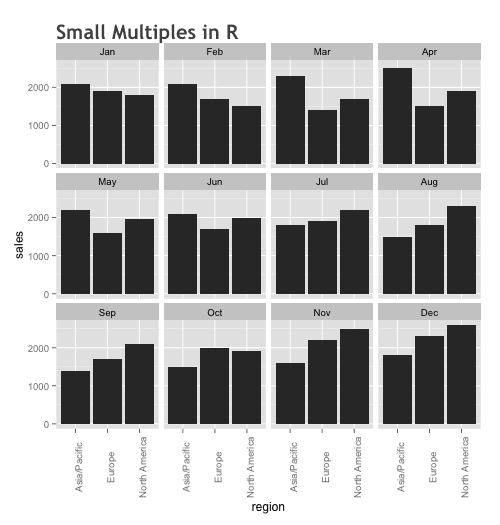
How to make a small multiples chart in R

An important principle in analyzing data is “overview first, zoom and filter, then details on demand” (quote: Ben Shneiderman) In practice, this typically means starting at a high level with a single chart, and then “zooming into” the data by replicating that chart for specific subsets of the dataset. And, even more valuable is being … Read more

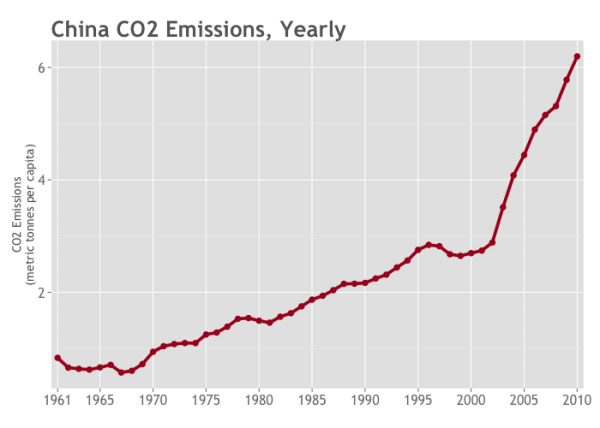
How to build an R line chart, step by step (and the importance of process)

Last week, I was talking to a guy who’s learning analytics, coaching him on what skills to learn next and helping him plan a career path. He’s a smart guy with an analytical background and minor coding experience, but he’s new to R.

Towards the end of the conversation, I asked him, “what’s the biggest challenge you have right now, learning analytics.”

His response? “The code is intimidating.”