Mapping oil production by country in R
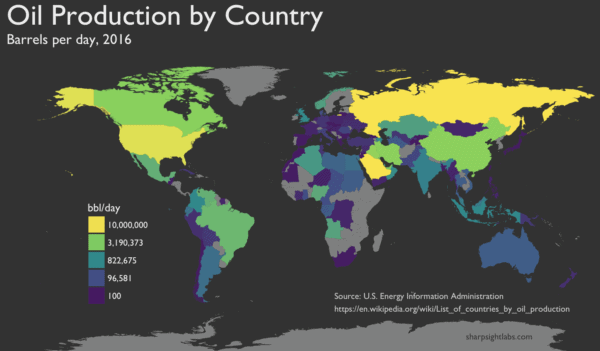
This week, here’s another map: a map of world oil production that you can create using R.
As I’ve mentioned, projects like this – a few hundred lines of code, with a variety of functions from the tidyverse – are excellent practice for intermediate data scientists.