This is a new installment in a series of tutorials showing you how to analyze covid-19 data with Python.
In the last few tutorials, we’ve done quite a bit of work.
For part 1, we retrieved the dataset for “confirmed” cases, and “wrangled” it into shape.
In part 2, we retrieved the files for confirmed, dead, and recovered, and we automated the data retrieval and wrangling process using a group of new Python functions.
In part 3, we did some initial data inspection to explore and check that the data looked “correct”.
And in part 4, we explored the data with data visualization.
Today, we’re going to modify the dataset and create a new variable. This new variable is a little more complicated than most, so we’ll devote an entire blog post that explains how to create it, step by step.
A quick overview of the tutorial
In this tutorial, we’re going to calculate the daily new cases of covid-19.
It sounds simple, but not so fast ….
We’re going to calculate the daily new cases by country and subregion, for every country or subregion.
It’s really not terribly difficult to do, once you know how to do it, but if you don’t know how to do it, it’s challenging.
That being the case, I’m going to walk you through how to calculate new daily cases by country/subregion.
I’ll show you how to do it, but I’ll also show you how to think about attacking the problem.
If you’re at a beginner to intermediate level at Python data wrangling, this will be helpful for improving your problem solving skills.
Table of contents
Just to help you navigate, here’s a quick table of contents.
Table of Contents:
- An explanation of what we’re trying to do
- An explanation of how we will approach the problem
- Tutorial explaining how to calculate new cases with Pandas
You can click on any of the links and it will take you to a specific section of the tutorial.
As always though, it will be best if you read the whole thing and run some of the code yourself.
What we’re trying to do
To understand what we’re trying to do, it’s best to look at proposed end result.
We want to add a new variable that shows the daily new cases.
Up until now, our dataset has had the covid-19 confirmed cases, deaths, and recovered cases.
In parts 1 to 4 of this series, our dataset has looked something like this:
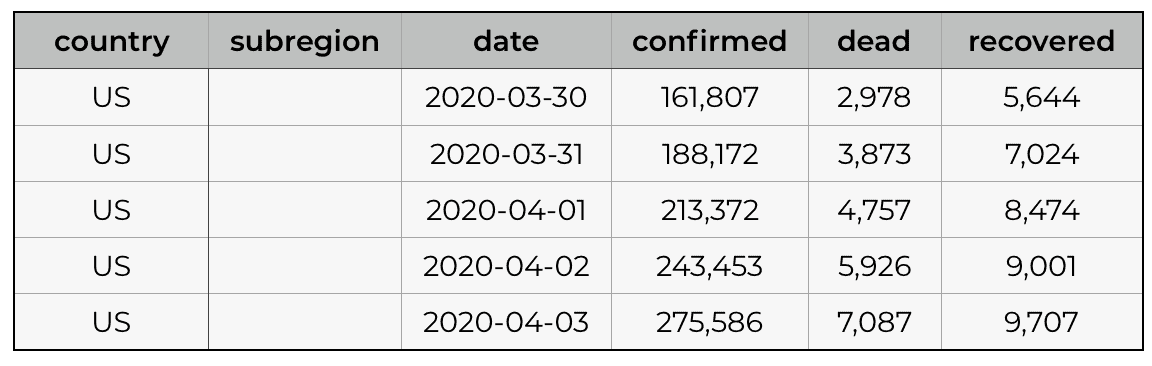
(The above example is a subset with a few rows and a few critical columns, for the purposes of explanation.)
Notice that the data has confirmed cases by date, for a particular country. For some countries in the dataset (i.e., China) this is broken down even further by subregion (i.e., Hubei, Beijing, etc).
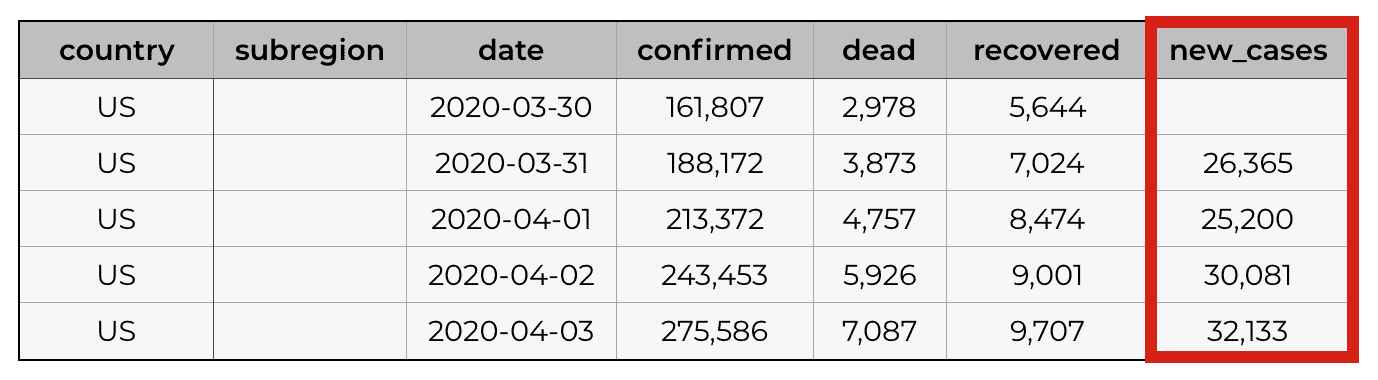
What we want is a dataset that has all of the data from the prior dataset, but we want to add a new column for new cases. An example subset for a few dates for the USA would look something like this:
That’s not terribly hard, if you know the right Python functions, although if you’re a beginner with Panda and data manipulation in Python, it might still be a bit hard.
However, the harder part comes when you need to do this for a large dataset, and you want to calculate the new cases strictly by country, and separately for each country or subregion.
So ultimately, we need something that looks more like this:
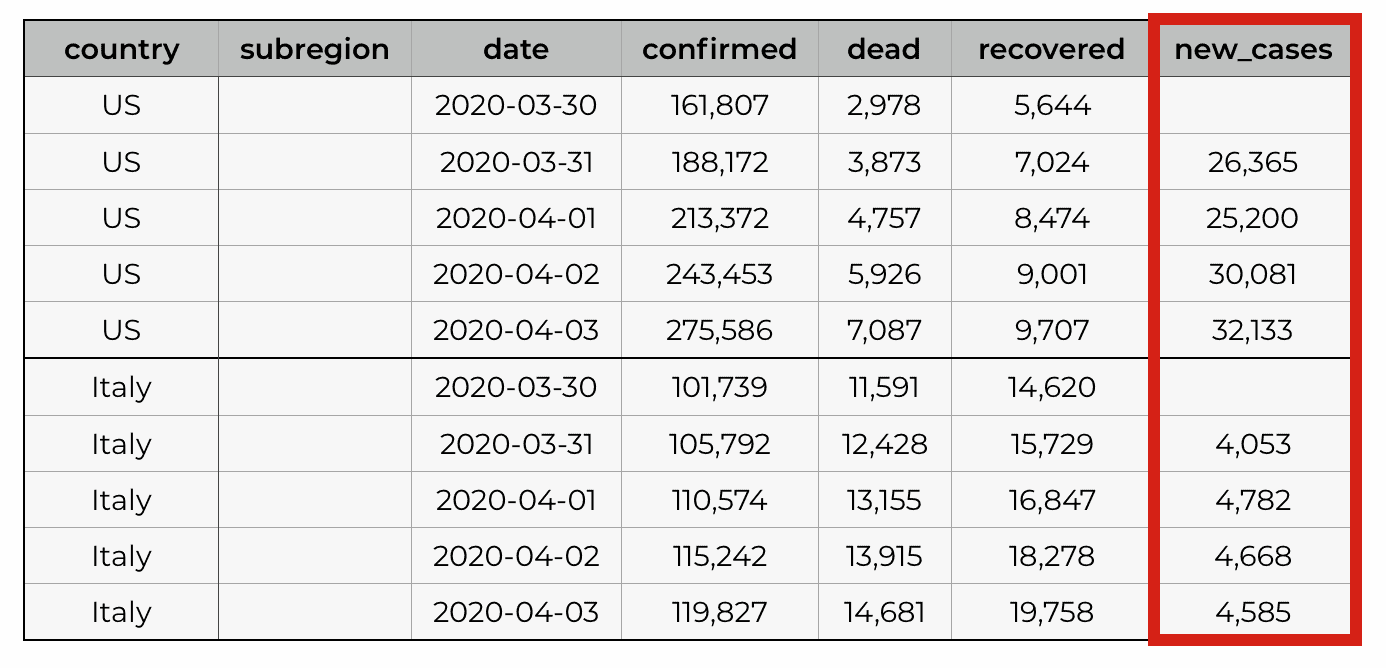
Notice that the new cases are counted by day, but separately for each country.
So we’re trying to create a new variable, that calculates daily new cases for every country or subregion.
How we will attack this problem
As I mentioned earlier … this is not terribly difficult, but it’s not terribly easy either.
That said, there are skills you will need, and you need to approach the problem in the right way.
Skills you’ll need
Creating a variable like this requires an intermediate level of skill with Pandas data manipulation.
To do this, you need to have a strong mastery of the essential Pandas data manipulation methods.
In particular, we’ll be using:
- assign
- filter
- groupby
- query
And a few other Pandas functions like reset_index.
Critically, we’ll also need to use the Pandas diff function.
If you don’t know these skills, that’s okay
If you don’t know the above skills, that’s okay.
You can still follow along by reading the tutorial, copy-pasting the code, and running it. You can still learn quite a lot by following the code, step by step.
Having said that, if you’re serious about mastering data manipulation, you should consider enrolling in our Pandas course or our Python Data Mastery course.
We’ll attack this problem in pieces
In terms of process, we’re going to attack this problem in pieces.
We’ll first just try to calculate the new_cases variable for a small subset of data … one country.
After we get that working, we’ll try two countries.
Finally, we’ll take what we learn about how to do this, and we’ll apply it to the whole dataset.
As we do this, notice a few things:
- We solve hard problems by breaking them into small problems
- We start simple, and then increase the complexity
These are general problem solving skills. Learn them. They will help us here, but they will help you personally as you try to solve your own problems in your data science projects.
Ok. Enough with all the preliminary BS.
Let’s sling some code.
How to calculate “new cases” for covid19
As I mentioned earlier, we’re going to attack this problem in steps:
- Calculate daily new cases for one country
- Calculate new cases for two countries
- Create new cases variable for entire dataframe
Preliminary code steps
Before you run any of the code below, we need to import some packages and get the dataset.
Import packages
Here, we’ll import Pandas, Seaborn, and datetime.
#================
# IMPORT PACKAGES
#================
import pandas as pd
import seaborn as sns
import datetime
We’ll obviously use Pandas for data manipulation. We’ll use datetime to properly set up our date variable in our dataset. And we’ll probably use Seaborn to plot our data (to check it).
Get covid-19 data
Next, let’s get the covid-19 dataset.
You can download the covid-19 data from April 4, 2020 by running the following code:
#============
# IMPORT DATA
#============
covid_data = pd.read_csv('https://learn.sharpsightlabs.com/datasets/covid19/covid_data_2020-04-04.csv'
                         ,sep = ";"
                         )
covid_data = covid_data.assign(date = pd.to_datetime(covid_data.date, format='%Y-%m-%d'))
covid_data = covid_data.fillna(value = {'subregion':''})
Obviously, this data will not be up to date any time after April 4, 2020. It will still generally work for this tutorial, but it won’t be completely up to date with the most recent covid-19 data.
Alternatively, you can run the code in part 2 of the Python covid-19 series to create an up-to-date dataset.
Ok … let’s start with a simple case.
Calculate new cases for one country
Here, we’re going to subset our data down to the data for one country: the United States.
We’re doing this because it will be much simpler to try to solve this problem for a single country. We can run the code, test it on a small subset, and if it works, move on to a more complicated dataset.
(Remember what I said earlier: we can solve hard problems by breaking them into smaller problems.)
Subset down to USA data
To subset the data, we’re going to use the Pandas query method. The query method enables you to subset the rows of the data based on some logical condition.
In the code below, notice the structure of the syntax as well.
We are “chaining” together two different Pandas methods (query and reset_index).
This is an extremely useful technique, and it’s still rarely used in the Python data science community. You should learn it.
Ok. So we’re taking the complete dataset, covid_data, and we’re subsetting the data down to the rows where the country variable is equal to "US".
Then, we’re just using reset_index to reset the index of the new data so that the numeric index starts at zero.
#-------------
# SUBSET TO US
#-------------
covid_data_US = (covid_data
                 .query('country == "US"')
                 .reset_index(drop = True)
)
We’ve also saved the output to a new variable name, covid_data_US.
Let’s print out the data.
print(covid_data_US)
OUT:
   country subregion       date      lat     long  confirmed  dead  recovered
0       US           2020-01-22  37.0902 -95.7129          1     0        0.0
1       US           2020-01-23  37.0902 -95.7129          1     0        0.0
2       US           2020-01-24  37.0902 -95.7129          2     0        0.0
3       US           2020-01-25  37.0902 -95.7129          2     0        0.0
4       US           2020-01-26  37.0902 -95.7129          5     0        0.0
..     ...       ...        ...      ...      ...        ...   ...        ...
68      US           2020-03-30  37.0902 -95.7129     161807  2978     5644.0
69      US           2020-03-31  37.0902 -95.7129     188172  3873     7024.0
70      US           2020-04-01  37.0902 -95.7129     213372  4757     8474.0
71      US           2020-04-02  37.0902 -95.7129     243453  5926     9001.0
72      US           2020-04-03  37.0902 -95.7129     275586  7087     9707.0
Here, due to my print settings, the printout is truncated.
But you can see the general structure of the data.
We have 73 rows … one row for each date. The value for country is US for all of the rows. And each row has data for the confirmed covid cases, as well as the deaths and recovered cases.
Keep in mind that we’re specifically going to be working with the confirmed variable.
Calculate daily new cases (test run)
Next, let’s test this out.
We’re going to calculate the daily new cases for this USA subset.
To do this, we’ll take our new dataframe, covid_data_US, and we’ll retrieve the confirmed variable using “dot” notation. This retrieves the confirmed variable as a Pandas series.
Then, we’ll use the diff() method to calculate the difference. Remember: by default, the diff method calculates the difference compared to the previous row.
(covid_data_US
 .confirmed
 .diff()
)
OUT:
0         NaN
1         0.0
2         1.0
3         0.0
4         3.0

68    20921.0
69    26365.0
70    25200.0
71    30081.0
72    32133.0
So what is this?
The numbers generated by our code are the daily new cases. It’s just the difference in “confirmed” cases from one day to the next.
If you go back to the covid_data_US dataframe and look at the confirmed cases, you can actaully confirm that these numbers are correct.
If you want to check, get a calculator and manually subtract the confirmed cases from one date from the confirmed cases for the following date. If you do this a few times, you’ll be able to confirm that the numbers are correct.
And actually, this is a good time to point out that you should constantly inspect and check your numbers. Doing a few old-fashioned, manual calculations with a calculator or a spreadsheet can go a long way towards confirming the accuracy of your data.
Add new variable: new cases
Now, let’s actually modify covid_data_US by adding the new variable new_cases.
We’re essentially going to apply the “test” code from the previous section to our covid_data_US dataframe to create a new variable.
To do this, we’ll use the Pandas assign method to create the new variable, new_cases.
covid_data_US = (covid_data_US
                 .assign(new_cases = covid_data_US.confirmed.diff())
                 )
And now that we’ve added the new variable and saved the output, let’s print out the dataframe.
print(covid_data_US)
OUT:
   country subregion       date      lat  ...  confirmed  dead  recovered  new_cases
0       US           2020-01-22  37.0902  ...          1     0        0.0        NaN
1       US           2020-01-23  37.0902  ...          1     0        0.0        0.0
2       US           2020-01-24  37.0902  ...          2     0        0.0        1.0
3       US           2020-01-25  37.0902  ...          2     0        0.0        0.0
4       US           2020-01-26  37.0902  ...          5     0        0.0        3.0
..     ...       ...        ...      ...  ...        ...   ...        ...        ...
68      US           2020-03-30  37.0902  ...     161807  2978     5644.0    20921.0
69      US           2020-03-31  37.0902  ...     188172  3873     7024.0    26365.0
70      US           2020-04-01  37.0902  ...     213372  4757     8474.0    25200.0
71      US           2020-04-02  37.0902  ...     243453  5926     9001.0    30081.0
72      US           2020-04-03  37.0902  ...     275586  7087     9707.0    32133.0
Take a look at that last column, new_cases.
The new cases equal the confirmed cases for that day, minus the confirmed cases for the previous day.
So for example, let’s take a look at the row for April 3, 2020: The new cases are calculated as 32,133. The confirmed cases for April 3 are 275,586. The confirmed cases for the previous day (April 2), are 243,453.
275,586 minus 243,453 equals 32,133.
If you manually check the new_cases variable, the data look correct.
Calculate new cases for two countries
Ok. Now, we’re going to perform the calculation for two countries.
In the previous example, we did the calculation for one country. That’s because it was simple to do, which enabled us to test out the general process.
Now, we’ll simply increase the complexity slightly and try to make this work for two countries.
Subset down to two countries
Calculating the new cases by country for two countries is a little more complicated than the previous example. Still, we’ll still simplify the problem as much as possible.
Here, we’ll subset the data down to two countries, the US and Italy.
Furthermore, we’ll retrieve only a few dates, and only the essential columns. This will just make it easier to read and check the data.
We’ll take the original dataframe, covid_data, and use the Pandas query method to retrieve only the rows for US and Italy. We’ll also use query to retrieve only the rows where date is greater than March 30, 2020.
And finally, we’ll use the Pandas filter method to retrieve only a subset of columns … country, date, and confirmed.
covid_data_US_IT = (covid_data
                    .query('country in ["US","Italy"]')
                    .query('date >= datetime.date(2020, 3, 30)')
                    .filter(['country','date','confirmed'])
                    .reset_index(drop = True)
)
The final output is named covid_data_US_IT.
Let’s print it out to see what it looks like.
print(covid_data_US_IT)
  country       date  confirmed
0   Italy 2020-03-30     101739
1   Italy 2020-03-31     105792
2   Italy 2020-04-01     110574
3   Italy 2020-04-02     115242
4   Italy 2020-04-03     119827
5      US 2020-03-30     161807
6      US 2020-03-31     188172
7      US 2020-04-01     213372
8      US 2020-04-02     243453
9      US 2020-04-03     275586
Test: calculate new cases (the wrong way!)
Now that we have our subset, let’s try to calculate the new cases.
Here, we’re going to use the naive approach and simply try to apply the code from the previous section.
I want to emphasize:
THIS WILL NOT WORK.
It’s going to give us the wrong data for the new_cases field.
But it will give us some valuable information about what we need to do next.
(covid_data_US_IT
 .assign(new_cases = covid_data_US_IT.confirmed.diff())
)
OUT:
  country       date  confirmed  new_cases
0   Italy 2020-03-30     101739        NaN
1   Italy 2020-03-31     105792     4053.0
2   Italy 2020-04-01     110574     4782.0
3   Italy 2020-04-02     115242     4668.0
4   Italy 2020-04-03     119827     4585.0
5      US 2020-03-30     161807    41980.0
6      US 2020-03-31     188172    26365.0
7      US 2020-04-01     213372    25200.0
8      US 2020-04-02     243453    30081.0
9      US 2020-04-03     275586    32133.0
Notice that some of the rows are actually correct.
For example, the new cases for Italy on 2020-03-31 is correct.
The row for the US for 2020-04-02 is also correct.
But the row at the boundary between the US data and the Italy data is not correct (i.e., the row for the US on 2020-03-30).
To fix this, we’ll need to modify our code slightly.
Second try: calculate new cases, by country
What we ultimately want is a variable that calculates the new cases by date, but strictly for a specific country.
So in the dataset, at the boundary between one country and another, it should not calculate the new cases. For example, it should not caluclate the new cases at the boundary in the data between the US and Italy.
How do we do this?
We need to group the data.
Here, we’re going to use the Pandas groupby method to “group” our data by country, and then calculate the daily difference of the confirmed variable.
new_cases_US_IT = (covid_data_US_IT
 .groupby(['country'])
 .confirmed
 .diff()
)
Here, we’re storing these calculated daily new cases as new_cases_US_IT.
We can add that data to the original dataframe using the Pandas assign method:
covid_data_US_IT = covid_data_US_IT.assign(new_cases = new_cases_US_IT)
And now let’s print out the data.
print(covid_data_US_IT)
OUT:
  country       date  confirmed  new_cases
0   Italy 2020-03-30     101739        NaN
1   Italy 2020-03-31     105792     4053.0
2   Italy 2020-04-01     110574     4782.0
3   Italy 2020-04-02     115242     4668.0
4   Italy 2020-04-03     119827     4585.0
5      US 2020-03-30     161807        NaN
6      US 2020-03-31     188172    26365.0
7      US 2020-04-01     213372    25200.0
8      US 2020-04-02     243453    30081.0
9      US 2020-04-03     275586    32133.0
Take a look at the new_cases variable.
It calculates the daily new cases, but only within a country.
So for the row for “US 2020-03-30”, you can see that the new cases is NaN, meaning “not a number”.
What that’s telling us is that our code is only calculating new cases for a particular country.
If there’s a row of data for a given country and the data for the previous date does not exist, it produces a “null” result … it does not look at the previous row, if the previous row is for a different country.
Again, I want to point out that the secret to getting this to work is using the Pandas groupby method correctly.
Having said that, let’s move on to the entire dataframe.
Create new cases variable for entire dataframe
Now that we’ve gotten the code to work for a small subset, let’s apply the technique to the whole dataset.
Here, we’re going to calculate the daily new cases for the entire covid_data dataframe.
To do this, we’ll use the same technique as the previous example.
But there will be one difference: we’ll group by both country and subregion. That’s because in the covid_data datafame, some data is at the country level (e.g., US) and some data is at the subregion level (e.g., Hubei or Beijing for China).
Let’s run the code.
First we’ll calculate the new cases.
new_cases_ALL = (covid_data
 .sort_values(by = ['country', 'subregion', 'date'])
 .filter(['country','subregion','date','confirmed'])
 .groupby(['country','subregion'])
 .confirmed
 .diff()
)
And then add the new cases to the covid_data dataframe:
covid_data = covid_data.assign(new_cases = new_cases_ALL)
Inspect data
Now, let’s just print out a few subsets of the covid_data dataframe to make sure that this worked properly.
Check Subset: US
First, we’ll check the US.
(covid_data
 .query('country in ["US"]')
 .filter(['country','subregion','date','confirmed','new_cases'])
)
OUT:
      country subregion       date  confirmed  new_cases
17301      US           2020-01-22          1        NaN
17302      US           2020-01-23          1        0.0
17303      US           2020-01-24          2        1.0
17304      US           2020-01-25          2        0.0
17305      US           2020-01-26          5        3.0
      ...       ...        ...        ...        ...
17369      US           2020-03-30     161807    20921.0
17370      US           2020-03-31     188172    26365.0
17371      US           2020-04-01     213372    25200.0
17372      US           2020-04-02     243453    30081.0
17373      US           2020-04-03     275586    32133.0
Due to my diplay settings, it’s only printing out a few of the rows. But at a glance, it looks correct.
Check Subset: China
And now, let’s check the data for China.
China is a little different, because the data are reported at the “subregion” level.
So, we’ll query the data to retrive the rows for China, and take a look at the confirmed and new cases by date, for different subregions.
There’s a lot of data for China, so you might want to modify your display settings to print a smaller number of rows. (We just want to print out enough to see two or three subregions.)
pd.set_option('display.max_rows',100)
(covid_data
 .query('country in ["China"]')
 .filter(['country','subregion','date','confirmed','new_cases'])
 .head(n = 100)
)
OUT:
     country subregion       date  confirmed  new_cases
4161   China     Anhui 2020-01-22          1        NaN
4162   China     Anhui 2020-01-23          9        8.0
4163   China     Anhui 2020-01-24         15        6.0
4164   China     Anhui 2020-01-25         39       24.0
4165   China     Anhui 2020-01-26         60       21.0
4166   China     Anhui 2020-01-27         70       10.0
...
4234   China   Beijing 2020-01-22         14        NaN
4235   China   Beijing 2020-01-23         22        8.0
4236   China   Beijing 2020-01-24         36       14.0
4237   China   Beijing 2020-01-25         41        5.0
4238   China   Beijing 2020-01-26         68       27.0
4239   China   Beijing 2020-01-27         80       12.0
...
For the sake of brevity, I trunkated the data somewhat.
But if you check the China data at the level of subregion, it looks like our code worked.
The new_cases variable is being calculated separately for every sub region.
Closing thoughts and Next steps
Alright, alright, alright …
We’ve got our new_cases variable.
A few closing comments
Before wrapping this up, I want to reemphasize the fact that to do data manipulation like we’ve done in this tutorial, you need to have a strong command of Pandas.
If you’re a long time reader of the blog, you’ve probably heard me say again and again: data science is 80% data manipulation.
We can debate about the exact number, but the overall point stands.
Data manipulation is extremely important in data science. If you want to be great at data analysis, data visualization, machine learning, or any other major area of data science, it is critical that you master data manipulation.
If and when you get serious about learning data science in Python, you should enroll in one of our Python data science courses.
Next steps
Now that we have our new_cases variable, there are some new possibilities that have opened up in terms of visualization and analysis.
We can plot the daily new cases, plot the daily new cases for a set of countries (i.e., a small multiple chart). And we can probably create a heatmap now of the daily new cases, by country.
Again, this opens up a lot of great possibilities.
So if you want to see what we do next, make sure to sign up for our email list.
Sign up to learn more
Do you want to see part 6 and the other tutorials in this series?
Sign up for our email list now.
When you sign up, you’ll get our tutorials delivered directly to your inbox.
This is a great work! Organizing data sets for visualization and analysis is a real challenging task which requires knowledge of some essential packages (in the case of R) and modules (in the case of Python).
????????????
Thanks for the comment, Simon.
Indeed …. wrangling data into shape is a major part of the job, so it pays to put a lot of emphasis on the data manipulation packages & modules.
Another great tutorial Josh. Using the Covid-19 dataset on github from the New York Times I was able to add new cases to the state and county level. Thank you again for these important fundamentals.
I am looking forward to your next tutorial!
????????????