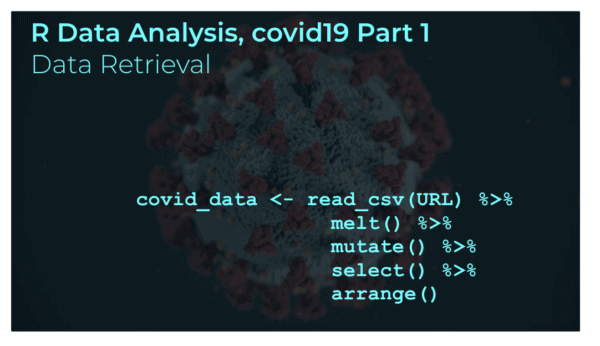
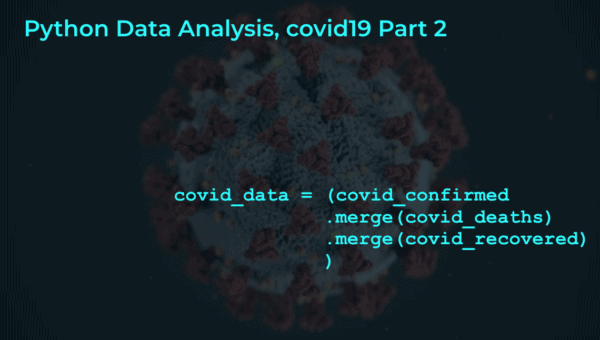
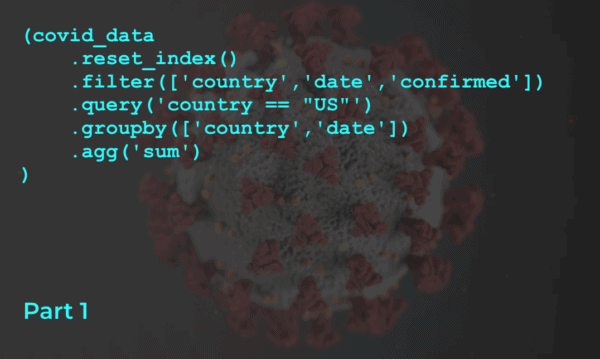
R Data Analysis: covid-19, part 2 [merge datasets]

This tutorial is part of a series of R tutorials analyzing covid-19 data. For part 1, see the following post: https://www.sharpsightlabs.com/blog/r-data-analysis-covid-19-part1-data-wrangling/ Covid19 analysis, part 2: merge datasets In this tutorial, we’re going to set up a process that will enable us to retrieve and wrangle some necessary covid19 datasets … data that we’ll need for … Read more

R Data Analysis: covid-19, part 1 [data wrangling]

An image of R data manipulation code, with an image of the covid19, sars-cov-2 virus in the background.

In this tutorial, we’re going to analyze covid19 data using R and the Tidyverse. Recently, we started a data analysis series, where we analyzed covid19 data. The first set of these tutorials was performed with Python. That tutorial series was well received, and many people commented that it was very helpful for seeing exactly how … Read more

Python data manipulation, covid19: how to calculate new cases

An image of a covid-19 dataset with a "new cases" variable added to the end.

This is a new installment in a series of tutorials showing you how to analyze covid-19 data with Python. In the last few tutorials, we’ve done quite a bit of work. For part 1, we retrieved the dataset for “confirmed” cases, and “wrangled” it into shape. In part 2, we retrieved the files for confirmed, … Read more

Analyzing covid-19 with Python, part 3 [data exploration]

An image of Python code analyzing covid19 data, with an image of the sars-cov-2 virus in the background.

This tutorial is part of a series of tutorials analyzing covid-19 data. For parts 1 and 2, see the following posts: https://www.sharpsightlabs.com/blog/python-data-analysis-covid19-part1/ https://www.sharpsightlabs.com/blog/python-data-analysis-covid19-part2/ Covid19 analysis, part 3: initial data exploration If you’ve been following along with this tutorial series, you’ll know that in the most recent tutorial, we defined a process for getting and cleaning … Read more

Python Data Analysis: covid-19, part 2 [merge datasets]

An image that shows Python syntax, merging datasets for a data analysis, with an image of the sars-cov-2 virus in the background.

This tutorial is part of a series of tutorials analyzing covid-19 data. For part 1, see the following post: https://www.sharpsightlabs.com/blog/python-data-analysis-covid19-part1/ Covid19 analysis, part 2: merge datasets In the previous tutorial in this series, we began analyzing covid19 data using Python. Specifically, in part 1, we created a process for getting the covid19 data for confirmed … Read more

Python Data Analysis: covid-19 data, part 1 [data wrangling]

An image that shows Python data analysis code, with a sars-cov-19 virus in the background.

If you’re like most people around the world, you’re probably concerned with the coronavirus, AKA, sars-cov-19, which for the sake of simplicity, I’ll refer to as covid-19. As you’re reading this, there’s a reasonable chance that you’re stuck working from home or otherwise quarantined in some way. Welcome to 2020 … it’s crazy. Assuming that … Read more

How to use Numpy flatten

An image that shows how Numpy flatten works.

This tutorial will show you how to use the Numpy flatten method. It will explain the syntax of the method and show you how to flatten an array in Numpy. The following is a table of contents. If you’re looking for something specific, you can click on any of the links to jump to the … Read more

np.random.randint Explained

This tutorial will explain how to use the np.random.randint function from Numpy (AKA, Numpy random randint). Ultimately, you’ll learn how to use Numpy to generate random integers drawn from a uniform distribution. The tutorial will explain the syntax of np.random.randint. It will also show you clear, step-by-step examples of how to use np.random.randint. The tutorial … Read more

Numpy standard deviation explained

An image that shows Numpy standard deviation computing the standard deviation of a Numpy array.

This tutorial will explain how to use the Numpy standard deviation function (AKA, np.std). At a high level, the Numpy standard deviation function is simple. It calculates the standard deviation of the values in a Numpy array. But the details of exactly how the function works are a little complex and require some explanation. That … Read more