This tutorial will clearly explain the Pandas index … what Pandas DataFrame indexes are, and how they work.
In the tutorial, I’ll explain what the index is, with clear pictures to help you understand.
I’ll also show you some Pandas code examples that will help you understand what indexes are and how they help us work with Pandas DataFrames.
You can click on any of the following links, and it will take you to the appropriate section in the tutorial.
Table of Contents:
Having said that, this tutorial will be most clear if you read it carefully, so I recommend that you read the whole thing.
A clear explanation of the Pandas index
I have to be honest.
There are quite a few tutorials and blog posts online about Pandas indexes.
I’ve seen several, and almost none of them make any sense.
There seems to be a lot of confusion about Pandas DataFrame indexes, so in this tutorial, I want to make it crystal clear. I’ll explain exactly what a Pandas index is, and how it works.
To do this though, I really need to explain DataFrames.
A quick review of Pandas DataFrames
The Pandas DataFrame is pretty straightforward.
A Pandas DataFrame is an object that stores data …. but it has a particular structure.
Pandas dataframes have a row-and-column structure
A DataFrame is a Python object that stores data in a row-and-column format.
The columns typically correspond to a particular variable, and the rows typically represent a record.
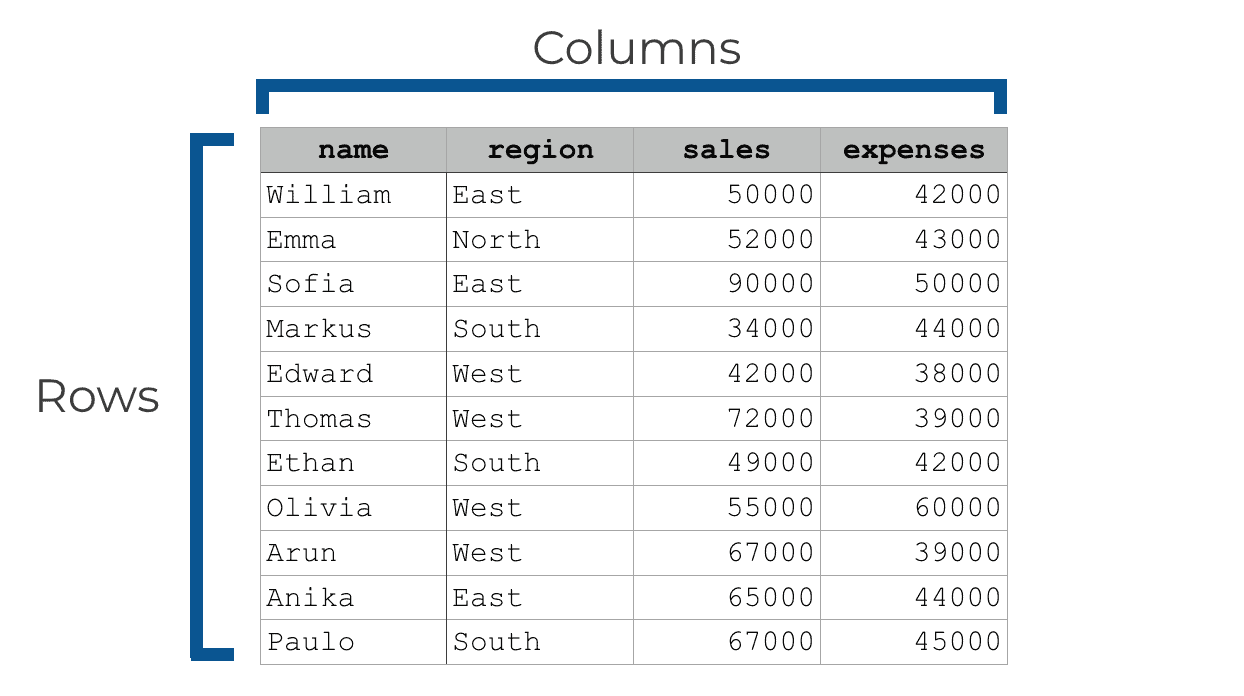
For example, if your DataFrame has sales data for a corporate sales team, you might have columns for things like name, region, sales, and expenses. In such a case, the rows themselves could represent information for a particular sales person.
Dataframe rows and columns have integer locations
When you create a DataFrame in Pandas, the DataFrame will automatically have certain properties.
Specifically, each row and each column will have an integer “location” in the DataFrame.
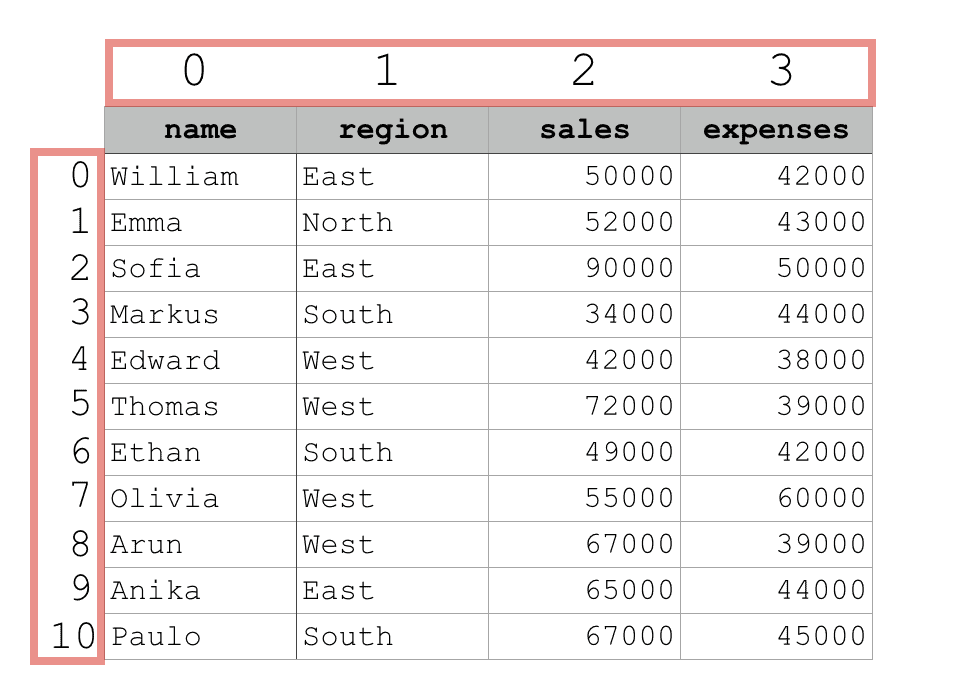
These integer locations for the rows and columns start at zero. So the first column will have an integer location of 0, the second column will have an integer location of 1, and so on. The same numbering pattern applies to the rows.
We can use these numeric indexes to retrieve specific rows and columns.
There are several ways to do this, but the most common is by using the Pandas iloc method. The Pandas iloc method enables you to retrieve rows and columns by the integer location.
But in addition to using the integer location, you can also access the rows by the “index”.
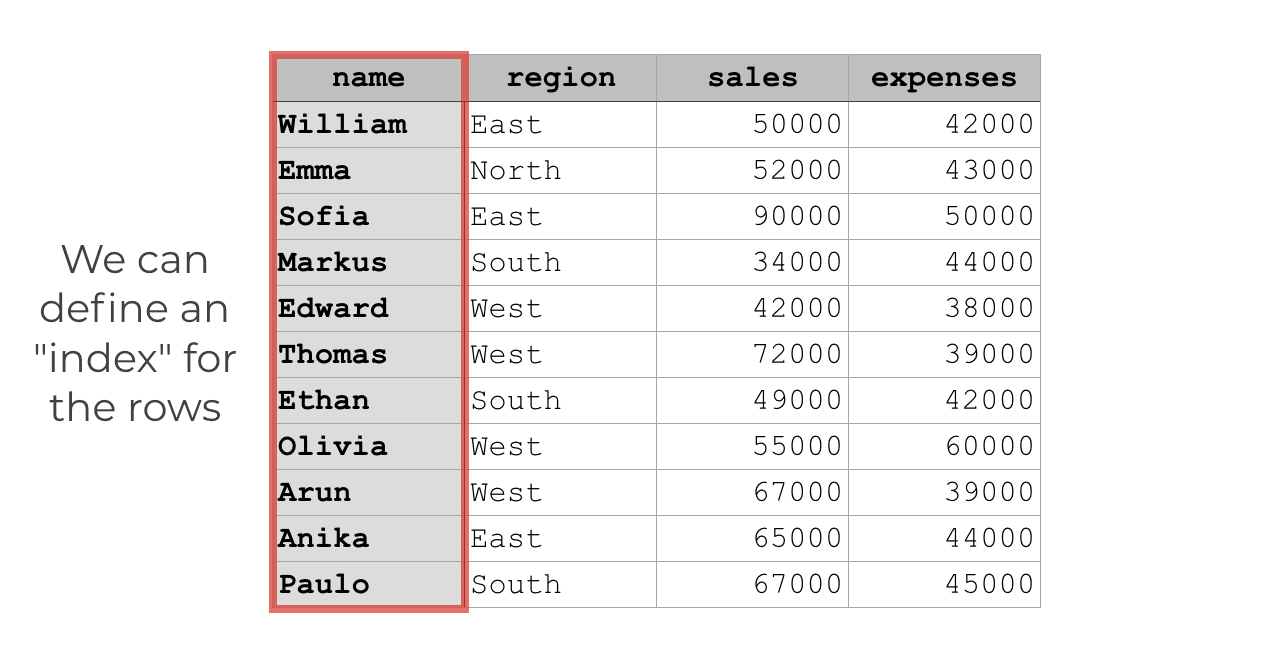
You can define a set of labels for the rows, which we call an index
Pandas allows you to define a label for the rows, which we call an “index”.
The terminology here can get a little bit confusing, however. Commonly, people will call the “integer location” that I mentioned in the previous section an “index”.
To clarify, I’ll refer to the integer locations for the rows and columns as the “integer location.” Having said that, it is a little confusing because of how Pandas creates an index by default.
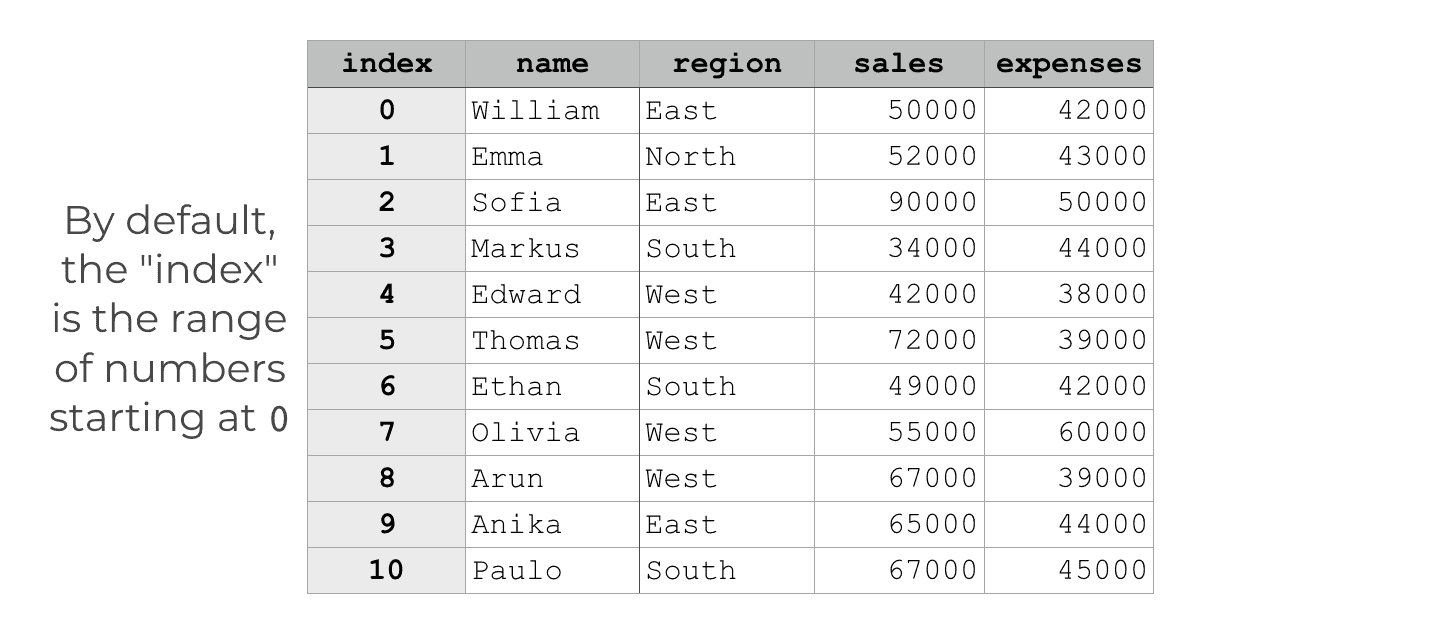
By default, the “index” is the range of numbers starting at zero
If you don’t explicitly define an index when you create your DataFrame, then by default, Pandas will create an index for the DataFrame.
This makes things a little more confusing, because by default the “index” is just the range of numbers starting at 0.
However, we can also manually define an index (i.e., a group of labels for the rows).
Hopefully this clears things up a little bit, but if you’re still confused, it’s probably best to work with some examples.
Examples of how to use a Pandas dataframe index
In this section, I’ll walk you through some examples of how to define and work with a Pandas DataFrame index.
The following list is a list of the examples. You can skip to something specific if you’d like, but it’s probably best to review all of the examples in order. The examples will build on each other.
Examples:
- Retrieve the index of a dataframe
- Set an index for a Pandas Dataframe
- Retrieve rows by index using Pandas loc
- Reset the index of the DataFrame
That being said, if you have a few minutes, it’s probably best to work through each of the examples in order.
Preliminary steps: run this code first
Before we actually work with the examples, we need to do a few preliminary steps.
We’ll need to import the Pandas package and also create a Pandas DataFrame.
Import Pandas
First, we’ll just import the Pandas package.
To do this, you can just run the following code:
import pandas as pd
This code will import the Pandas package with the nickname “pd“. We’ll be using this nickname to reference the Pandas package when we need to call specific functions.
Keep in mind that this code will only work if you already have Pandas installed on your computer or computing system. “Installing” Pandas and “importing” Pandas (with the code above) are two different things. If you don’t have Pandas installed on your machine, I recommend that you install the Anaconda Python distribution and then install Pandas through the Anaconda Navigator system.
Ok … assuming that you have Pandas imported by running the import code above, next you’ll have to create a DataFrame.
Create a dataframe
Here, we’re going to create a Pandas DataFrame called sales_data with the pd.DataFrame() function.
To do this, we’ll just call the DataFrame function, and then provide a dictionary of values inside of the parenthesis.
Ultimately, the dataset is a dummy dataset, intended to simulate sales data for a sales organization.
Let’s create the data first, and then take a look:
sales_data = pd.DataFrame({
"name":["William","Emma","Sofia","Markus","Edward","Thomas","Ethan","Olivia","Arun","Anika","Paulo"]
,"region":["East","North","East","South","West","West","South","West","West","East","South"]
,"sales":[50000,52000,90000,34000,42000,72000,49000,55000,67000,65000,67000]
,"expenses":[42000,43000,50000,44000,38000,39000,42000,60000,39000,44000,45000]})
Quickly, let’s print out the data, so you can see what it looks like:
print(sales_data)
OUT:
       name region  sales  expenses
0   William   East  50000     42000
1      Emma  North  52000     43000
2     Sofia   East  90000     50000
3    Markus  South  34000     44000
4    Edward   West  42000     38000
5    Thomas   West  72000     39000
6     Ethan  South  49000     42000
7    Olivia   West  55000     60000
8      Arun   West  67000     39000
9     Anika   East  65000     44000
10    Paulo  South  67000     45000
This DataFrame is fairly simple. It has 11 rows and 4 columns. The columns are name, region, sales, and expenses. Overall, this should be fairly easy to understand … the dataset contains sales and expenses for people on a sales team.
Notice one last detail: when we print out the data using the print() statement, there is a group of numbers on the far left side of the DataFrame.
Each row has a number next to it, to the left, starting at 0 and going up to 10 for the last row.
That’s the index!
Having said that, let’s take a closer look.
EXAMPLE 1: Retrieve the index of a dataframe
As you just saw in the previous section, when we created our DataFrame, Pandas created a default index.
The default index for this DataFrame is the range of numbers starting at 0.
In fact, that’s the default index for all DataFrames. Unless you specify a special index, or add an index after the DataFrame is created, the index will be this numeric range of values.
You can think of the index sort of like a special column, but it will not be listed with the columns.
Instead, you can retrieve the index by accessing the index attribute of the sales_data DataFrame.
Let’s do that.
Here, we’re going to retrieve and print out the index:
print(sales_data.index)
OUT:
RangeIndex(start=0, stop=11, step=1)
Notice that when we do this, the code returns a RangeIndex object. This is really just a special kind of index that defines the row index as a range of numbers.
Remember what I wrote earlier: by default, Pandas sets the index as the range of numbers starting at 0. That’s all that this RangeIndex object is doing. It’s defining the index of sales_data as the range of numbers from 0 to 10.
Next, let’s change the index to something else (once you see how we do that, the range index that we just retrieved might make more sense).
EXAMPLE 2: Set an index for a Pandas Dataframe
Here, we’re going to re-define the index of the DataFrame.
Specifically, we’re going to use one of the existing columns of the DataFrame as a new index.
To do this, we’re going to use the Pandas set_index function.
Use the Pandas set index function
Put simply, the Pandas set index function is a function that enables you to set one of the columns of DataFrame as the index.
Here, we’re going to set the name variable as the index.
Here’s the code:
sales_data.set_index('name', inplace = True)
And now let’s print out the DataFrame.
print(sales_data)
OUT:
        region  sales  expenses
name
William   East  50000     42000
Emma     North  52000     43000
Sofia     East  90000     50000
Markus   South  34000     44000
Edward    West  42000     38000
Thomas    West  72000     39000
Ethan    South  49000     42000
Olivia    West  55000     60000
Arun      West  67000     39000
Anika     East  65000     44000
Paulo    South  67000     45000
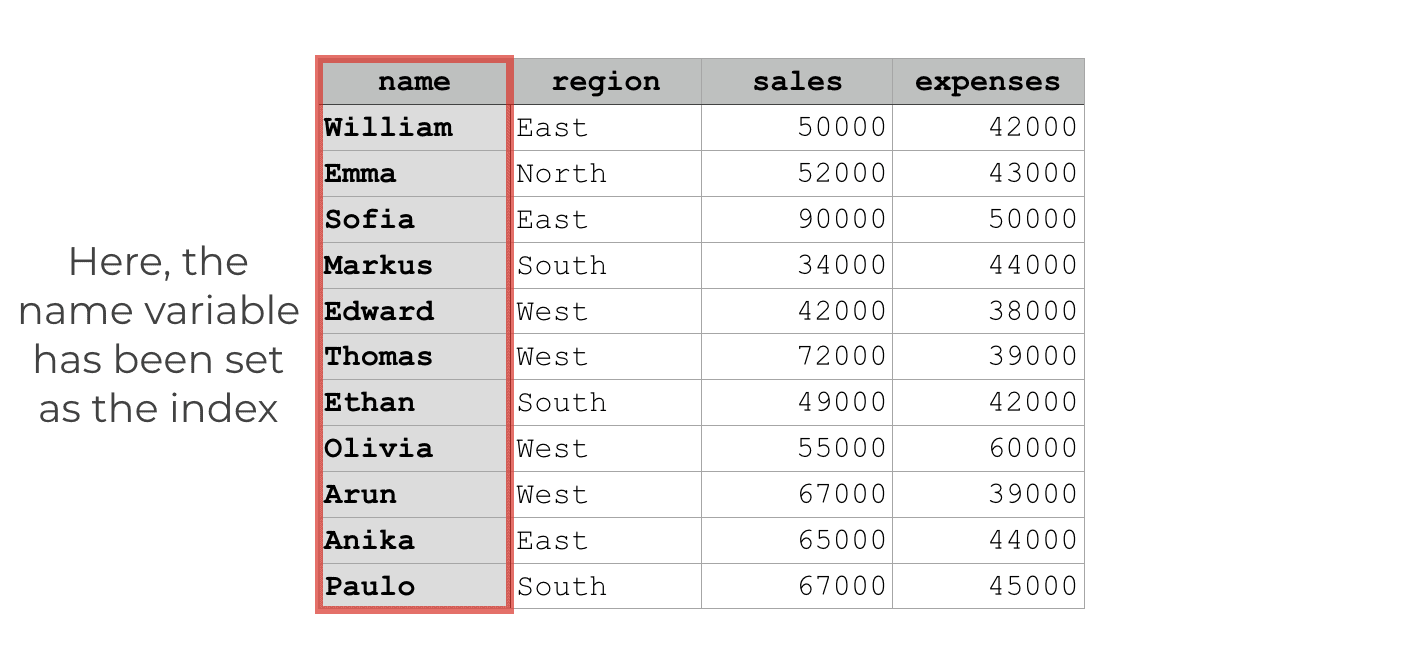
Notice that when we print out the DataFrame, the name column is now set off to the left side.
That’s because the name variable has now been set as the index.
We can check this by retrieving the index.
print(sales_data.index)
OUT:
Index(['William', 'Emma', 'Sofia', 'Markus', 'Edward', 'Thomas', 'Ethan',
       'Olivia', 'Arun', 'Anika', 'Paulo'],
      dtype='object', name='name')
Notice that when we print out the index, it now lists the elements of the “name” variable.
At this point, the name variable is no longer a column exactly. It has become the index of the DataFrame.
Visually, we can think of the new re-indexed DataFrame like this:
This means that we can use the values of this new index to retrieve the rows of the DataFrame.
Let’s do that in our next example.
(By the way, for more information about setting a Pandas DataFrame index, check out our tutorial about the Pandas set_index function.)
EXAMPLE 3: Retrieve rows by index using Pandas loc
In this example, we’re going to use the Pandas loc method to retrieve data.
Let me quickly explain what loc does.
The loc method enables you to select rows by a defined index. So in the last example in this blog post, we turned the name variable into the index for the sales_data DataFrame.
By doing this, we’ll be able to select a row or slice of rows by using the “name” of the person for that row.
![An example of using the .loc[] method to select a row of data from the sales_data DataFrame.](https://www.sharpsightlabs.com/wp-content/uploads/2022/01/sales_data-loc-example_v2.png)
Let’s take a look at an example, so you can see it in action.
Select a row by DataFrame index, using .loc
Here, we’re going to use the Pandas .loc method to select a single row of data from our DataFrame.
sales_data.loc['Markus',:]
OUT:
region      South
sales       34000
expenses    44000
Name: Markus, dtype: object
So what happened here?
We used the loc method to select a single row by the index value. In this particular case, we had set the name variable as the “index” for the sales_data DataFrame. That means that the individual names (like ‘William‘, ‘Sofia‘, ‘Markus‘, etc) have become the index values that identify each row.
The loc method enables us to use those index values to retrieve rows. That’s what .loc does.
Select a slice of data by DataFrame index, using .loc
Let me show you a related example.
Here, we’ll retrieve a so-called “slice” of data from the DataFrame.
To do this, we’re going to use the loc method and reference a range of names from our index.
In particular, we’re going to use .loc[] to retrieve all of the rows from ‘Markus‘ to ‘Thomas‘.
Here’s the code:
sales_data.loc['Markus':'Thomas', :]
And here is the output:
       region  sales  expenses
name
Markus  South  34000     44000
Edward   West  42000     38000
Thomas   West  72000     39000
Notice that loc enabled us to retrieve a range of data by ‘name‘.
Again, this is because we had already set the name variable as the index for the DataFrame. Once we have an index set up like we do here for sales_data, we can retrieve rows and slices of rows using the index values (i.e., ‘Markus‘ and ‘Thomas‘).
Keep in mind that this was a fairly simple example of using loc, but things can get a little more complicated. For more information on how to use the loc method, read our tutorial on Pandas loc.
EXAMPLE 4: “Reset” the index of the DataFrame
If you’ve been following along with the tutorial, you should have the DataFrame that we’ve been using, sales_data, set up with the name variable as the index. We set the index for the DataFrame in example 2.
Now, we’re going to un do that operation.
We’re going to remove the index from the DataFrame and make the name variable back into an ordinary column.
Remove dataframe index using reset_index
Here, we’re going to remove our Pandas dataframe index using the reset_index() method.
The .reset_index() method takes the existing index removes it. By default, when it removes the index, .reset_index() turns the index back into a regular column.
Let’s run the code and then I’ll explain:
sales_data.reset_index(inplace = True)
And now, let’s print out the DataFrame:
print(sales_data)
OUT:
       name region  sales  expenses
0   William   East  50000     42000
1      Emma  North  52000     43000
2     Sofia   East  90000     50000
3    Markus  South  34000     44000
4    Edward   West  42000     38000
5    Thomas   West  72000     39000
6     Ethan  South  49000     42000
7    Olivia   West  55000     60000
8      Arun   West  67000     39000
9     Anika   East  65000     44000
10    Paulo  South  67000     45000
Take a look specifically at the left hand side of the output. The name variable is no longer set off to the side. After running reset_index, the name variable is no longer the index. Instead, name has become an ordinary column in the DataFrame.
Now, after running reset_index, the range of integers starting at 0 has returned to the left side of the DataFrame. The range of numbers (starting at 0) is now the index again.
Check the dataframe index
We can confirm this by retrieving the index:
print(sales_data.index)
OUT:
RangeIndex(start=0, stop=11, step=1)
As you can see, the index of sales_data is now a “RangeIndex” object starting at 0.
This was a quick example to show you how to reset a Pandas index. However, there are a few details about the function that I didn’t explain. That being said, for a more detailed explanation of reset_index, check out our tutorial on the Pandas reset_index method.
Frequently asked questions about Pandas indexes
Now that we’ve worked through some examples that show you what Pandas indexes are and how they work, let’s discuss some common questions about Pandas DataFrame indexes.
Frequently asked questions:
- What’s the point of indexing in Pandas?
- Which index tool should I use, loc or iloc?
- How do I set the index for a Pandas dataframe?
Question 1: What’s the point of indexing in Pandas?
An index on a Pandas DataFrame gives us a way to identify rows. Identifying rows by a “label” is arguably better than identifying a row by number.
If you only have the integer position to work with, you have to remember the number for each row. So for example, if you only have an integer index, you have to remember that ‘Markus‘ is row number 3, and then use the number to retrieve the data for that row.
But if you set an index for a DataFrame (like setting the name variable as the index in the examples above), you can retrieve data by the index value (i.e., the row index value ‘Markus‘).
This makes data retrieval and data manipulation much, much easier. It’s even better if you choose create a good index for your DataFrame. We often have flexibility with regard to which variable(s) we select as an index. Choosing a good index for a DataFrame is a bit of an art (and it’s beyond the scope of this post).
Having said that, I’ll repeat: having a good DataFrame index makes data retrieval and data manipulation much easier.
Question 2: Which index tool should I use, loc or iloc?
It depends.
If you know the exact integer locations of your rows and columns, then iloc is a good option.
If you haven’t set an index yet using ‘set_index()‘, you can still use the loc method to identify columns by name, but you’ll have to use the integer locations to identify the rows. (See our loc tutorial to understand how.)
If you have set up an index, then the loc method becomes a much better option.
Ultimately though, it depends on how your data are structured and what you’re trying to do.
I recommend that you learn and practice both the loc method and the iloc method so you understand when to use each one.
Question 3: How do I set the index for a Pandas dataframe?
To set an index for a Pandas DataFrame, you can use the Pands .set_index method.
Example 3 of this tutorial briefly shows how to use set_index.
You can also review our set_index tutorial for a more detailed explanation of that tool.
Leave your other questions in the comments below
Do you have another question about Pandas indexes?
Leave your question in the comments below.
Join our course to learn more about Pandas
If you’re serious about learning Pandas, you should enroll in our premium Pandas course called Pandas Mastery.
Pandas Mastery will teach you everything you need to know about Pandas, including:
- How to subset your Python data
- Data aggregation with Pandas
- How to reshape your data
- and more …
Moreover, it will help you completely master the syntax within a few weeks. You’ll discover how to become “fluent” in writing Pandas code to manipulate your data.
Find out more here:
thanks for this article,
also can you check page https://www.sharpsightlabs.com/blog/pandas-set-index/,
it doesn’t seem to be working
Yeah, sorry about that.
That article is scheduled to be published next week. I just dropped the link into the article in advance so I didn’t forget about it.
It’ll be available soon!
Your each article is very commendable to understand for anyone with the very simplistic way .personally i could not find a better explanation for Python concepts than this …please keep on publishing..its a motivation to learn from SHARPSIGHT
Thanks Anurag …. we have a lot more tutorials on Python data science coming in 2020 and beyond
Excellent explanation! Very easy to grasp! Thank you for this post!
You’re welcome
Very good explanation. Im just starting off with using python.
For the sake of thoroughness, explaining the inplace attribute would make this a lot more complete. – Just a suggestion.
Also can you cite the reasons why one would have to use/should use the inplace true/false? (Any usecases would be good)
Most of the time I don’t use
inplace = True. But it can be useful when you use Pandas method chains with multiple steps.I have looked at quite a few Python/Pandas resources and you by far do the best job of explaining how things work. I am eagerly looking forward to enrolling in your Python master class at the first chance that I get!
Thanks … I try to explain things in a clear and straightforward way.
Thank you. This was very helpful. It cleared up a lot for me regarding dataframe labeling / referencing, especially in context of .loc, .iloc, and .index.
You’re welcome.