One of the the questions that I get over and over is, which data science language do I use?
I have my own preferences with regards to programming languages, but there’s not always a clear answer.
In fact, my standard answer is “it depends.”
You see, different languages are good for different things.
But what if we narrow the question down a little bit.
What if we ask “what’s the best language for data analytics?”
Well, in that case, I do have a recommendation.
My favorite data analytics language is R.
What is Analytics
Before I explain why I prefer R for data analytics, I should probably clarify what analytics is.
Data analytics is the process of getting, cleaning, transforming, and analyzing data to discover valuable insights.
Importantly, we use data analytics primarily to support decision-making. And as such, it’s often closely tied to business optimization and strategy.
In terms of the types of skills and activities, data analytics typically involves several steps, including:
- Data collection: This involves gathering data from various sources, which can include databases, files, external data feeds, user submissions, etc.
- Data processing: This involves cleaning the data (dealing with missing values, removing duplicates, etc.) and transforming the data into format that’s suitable for analysis.
- Data analysis: This involves performing aggregating and visualizing the data to discover patterns, relationships, and trends. The analysis can be exploratory (i.e., looking for patterns without having a specific question in mind) or confirmatory (testing a specific hypothesis).
- Interpretation and communication: This final step involves interpreting the results of the analysis and communicating those results to stakeholders. This typically involves creating visualizations, writing reports (often in Keynote or Powerpoint). It can also include building interactive dashboards.
I want you to remember these different parts of data analytics as we discuss the differences between analytics and data science.
How is Analytics Different from Data Science
So now, you might be asking, how is data analytics different from data science?
In my view, data analytics is a subset of data science.
Arguably, that probably was not always the case. Around the time that “data science” began to emerge in Silicon Valley (around 2010/2011), data science and data analytics were roughly the same. I know this, because at the time, I was working in the analytics department of a big bank, and said to one of my co-workers “they’re starting to call our field ‘Data Science’ out in California.” She was not impressed.
So in those early phases, data science and data analytics were mostly the same.
But over the last 10 to 15 years, they’ve diverged somewhat.
Or more accurately, data science has expanded beyond mere data analytics to include more advanced forms of machine learning, deep learning, and AI.
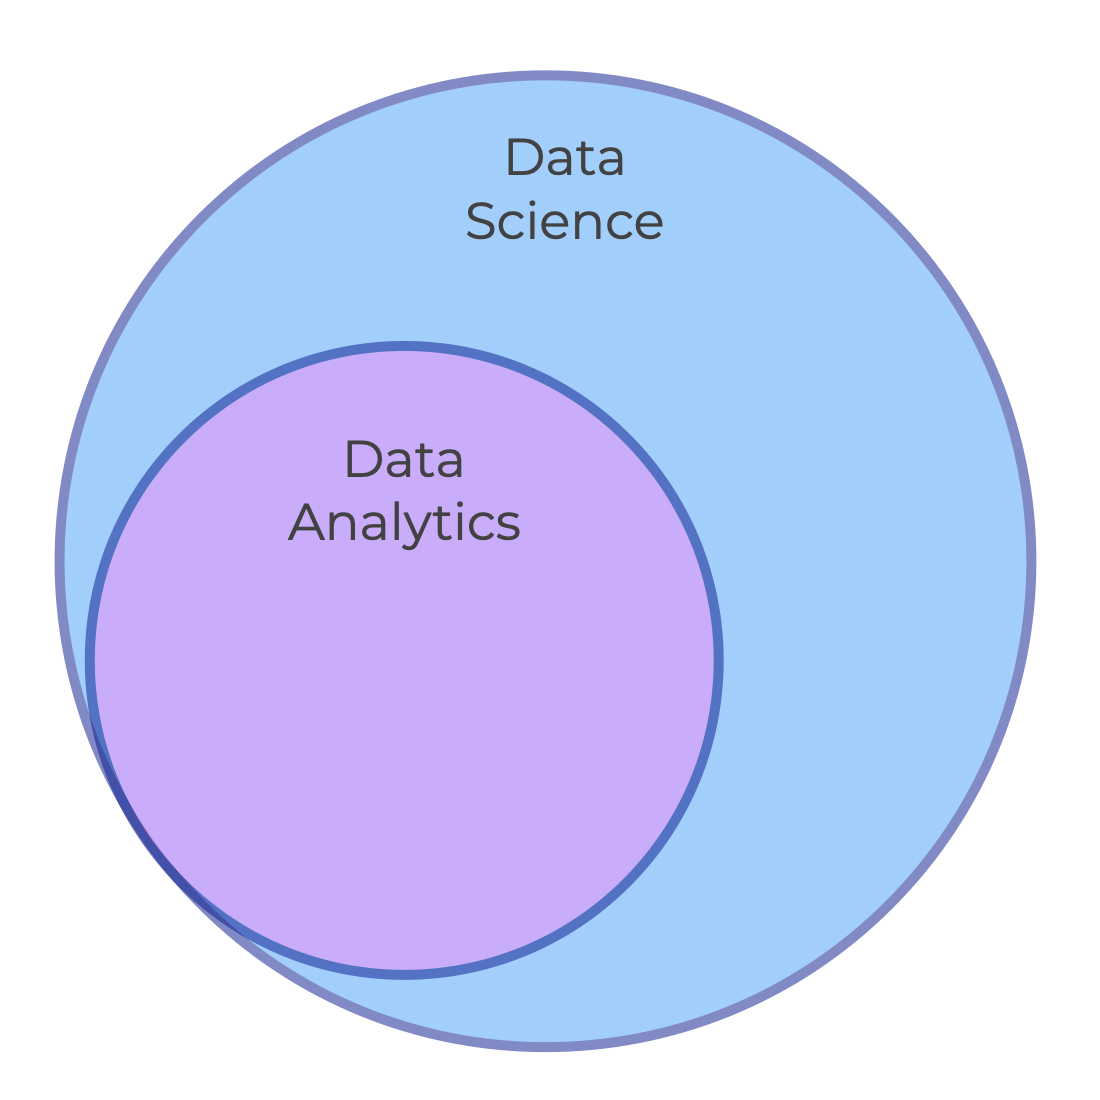
So today, although data science includes advanced data-centric topics like ML and deep learning, data analytics still refers more narrowly to the process of getting, cleaning, transforming, and analyzing data to discover valuable insights.
That’s exactly what R excels at.
R’s Tidyverse Excels at Data Wrangling, Visualization, and Analysis
To be clear, when I say “R,” I really mean the Tidyverse dialect of R, which is the modern data toolkit for R. The original R programming language was a little clumsy.
Why is R’s Tidyverse exceptional for data analytics?
Because the Tidyverse has packages that are specifically designed for the different parts of data analytics:
- dplyr for data wrangling: The dplyr package is designed for gathering, cleaning, and transforming data. We commonly call this “data wrangling.” The Tidyverse also includes some “helper” packages for data wrangling, like forecats, tidyr, reader, stringr, and a few others.
- ggplot2 for data visualization: The ggplot2 package is specifically designed for data visualization. It has tools for creating all of the basic charts like line charts, bar charts, histograms, and more. And it also has tools for creating more advanced data visualizations.
- dplyr + ggplot for data analysis: For data analysis, you can combine tools from dplyr and ggplot2.
There are also several auxiliary packages like forcats, tidyr, reader, and a few others, that provide additional tools in support of the above tasks.
Tidyverse Packages are Better at Analytics than Python Packages
Now, you might be thinking …. Python also has packages that are specifically designed for data wrangling and visualization.
For example, Python has Pandas and Numpy for data wrangling.
Python also has Seaborn and Matplotlib for data visualization (among a few others).
So isn’t Python just as good as R for analytics?
In my opinion, no.
The design of the R/Tidyverse packages is much better. Dplyr is much more intuitive than Pandas. ggplot2 is more intuitive than Seaborn, and a lot more intuitive than Matplotlib.
A lot of the difference has to do with the syntax. Dplyr syntax is more intuitive than Pandas. And dplyr makes it somewhat easier to combine functions together to do complex data manipulations using the “pipe” operator. Python’s Pandas package also has a way to connect multiple tools, but it’s somewhat harder to use, and it’s often more of a struggle to do things in Pandas that are relatively easy with R’s dplyr.
The same issues come up with Python’s visualization tools in comparison with R’s. Python’s Seaborn is somewhat easy to use, but it’s less flexible and less powerful than ggplot2. Python’s Matplotlib is very powerful, but it’s much more difficult to use than R’s ggplot2. It’s worth noting that Python has a new visualization package called Seaborn Objects (a new sub-package within the original Seaborn package), that is powerful and flexible like R’s ggplot2. However, the new Seaborn Objects package is still in development, so it’s missing some important functionality.
Moreover, in R, dplyr and ggplot2 were designed to work together (again, using the “pipe” operator). This allows the user to perform powerful data analysis … especially data exploration. Python’s data wrangling and data visualization tools have a lot more difficulty working together, as they were not really designed for it.
Ultimately, if we’re talking about data wrangling, data visualization, and data analysis in relative isolation, I think that R’s Tidyverse packages beat the corresponding Python packages.
R is simply better for the core skills that I would define as “data analytics.”
If you Want to Focus on Analytics, R is the Better Choice
So here’s my recommendation: if you’re mostly interested in analytics, you might want to use R.
That is to say, if you’re interested in analyzing data, but you don’t care about more advanced topics like machine learning, deep learning and advanced data science topics, R is probably a better choice.
Personally, when I need to analyze data, I prefer to use R.
What are Your Thoughts
What do you think?
Do you agree that R is better for data analytics?
Do you prefer dplyr and ggplot to Pandas and Matplotlib?
I want to hear from you.
Leave your comments in the comments section below.
Hey Josh, I’ve been having this debate with a few different people. What makes you a 10x developer in Data Science? What makes you a competent coder who will become 10x with ChatGPT?