If you want to master machine learning and AI, you’ll need to learn and master a variety of minor concepts that underpin these systems.
One such concept is the classification threshold.
The classification threshold is critical for a large number of machine learning algorithms – from logistic regression to neural network classification – and it’s particularly important for binary classification tasks.
Understanding classification threshold is important not only because model performance generally relies on the threshold setting, but more specifically, because the threshold determines performance on a variety of classification metrics.
Given the importance of this concept, I want to explain what it is as clearly as possible.
So in this tutorial, I’ll explain what classification thresholds are and how they work. I’ll also show you a clear example, and then explain how the value of classification threshold affects various classification metrics.
I recommend that you read the whole tutorial, because I’m going to try to build up your understanding of this concept from first principles.
But, if you need something specific, just click on any of the following links. Each link will take you to a specific part of the tutorial.
Table of Contents:
- A Quick Review of Classification in Machine Learning
- Introduction to Classification Thresholds
- How Classification Threshold Affects Classification Metrics
- Frequently Asked Questions
A Quick Review of Classification in Machine Learning
Classification is one of the cornerstones of machine learning. It involves categorizing examples into predefined classes or groups. Said differently, classification involves predicting the appropriate label for an incoming data example, from a predefined set of possible labels.
In the context of binary classification, the classification threshold is at the heart of classification for many types of classification algorithms.
The threshold of a binary classifier is the decision boundary that determines how the model classifies an incoming example into one of the two groups.
And importantly, the threshold is a parameter that you can change. Changing the value of the threshold changes the behavior of the classifier, such as the number of True Positives, True Negatives, False Positives, and False Negatives it produces. And furthermore, changing the threshold will change downstream metrics like precision and recall.
To further explain this, let’s look at an example.
A Classification Example: The Cat Detector
The Cat Detector is an example that I like to use when I explain classification concepts because, well, everyone knows what a cat looks like, so we can intuitively understand what the system is doing. (You DO know what a cat looks like, right?)
Ok …
Let me explain how it works, and then we’ll get to how the threshold is involved.
The Cat Detector is simple: you give it a picture, and it tells you if it’s a picture of a cat or not.
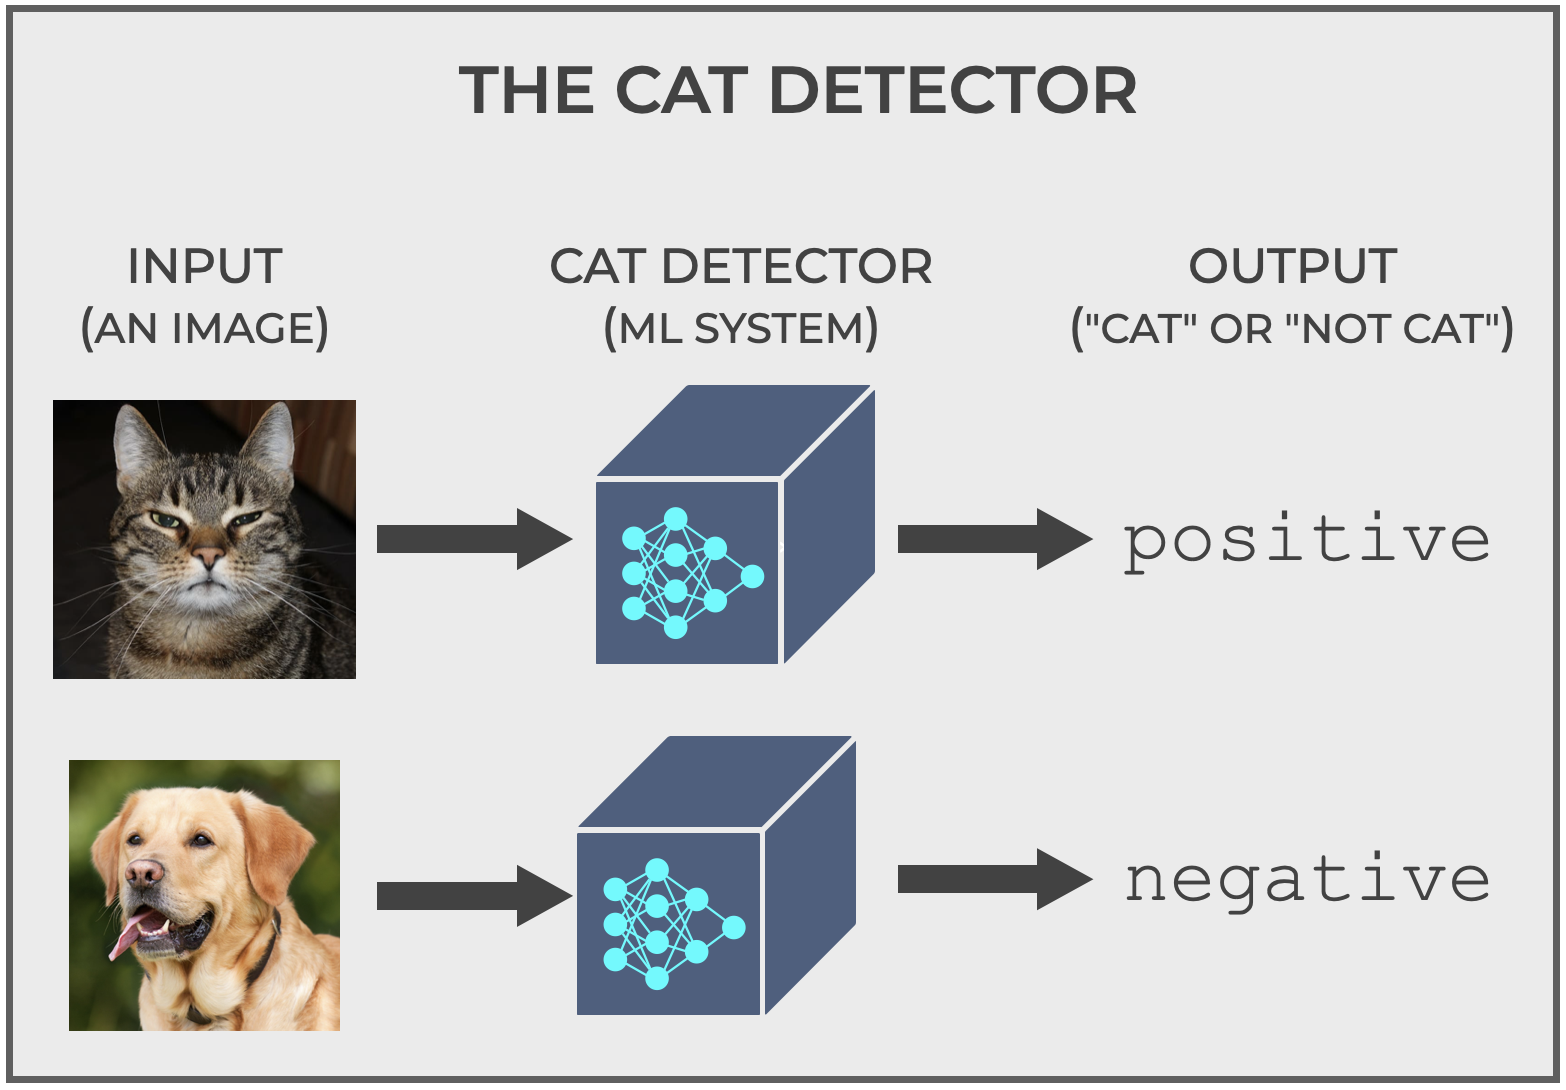
For our purposes, the system will output the labels positive and negative (positive if it predicts cat, negative if it predicts non-cat). That’s somewhat important, because it will help us understand some classification metrics, but the labels could just as easily be cat and non cat.
Classification is Often Probabilistic
Next, let’s talk at a high level about how classifiers determine positive and negative.
There are a variety of different types of algorithms for performing classification.
But broadly, there’s a group of classifiers that work in a probabilistic way.
Essentially, internally, they produce a probability – a number between 0 and 1 – that encodes how likely it is that the example belongs to the positive class (although, you can re-frame these numbers as percents as seen below).
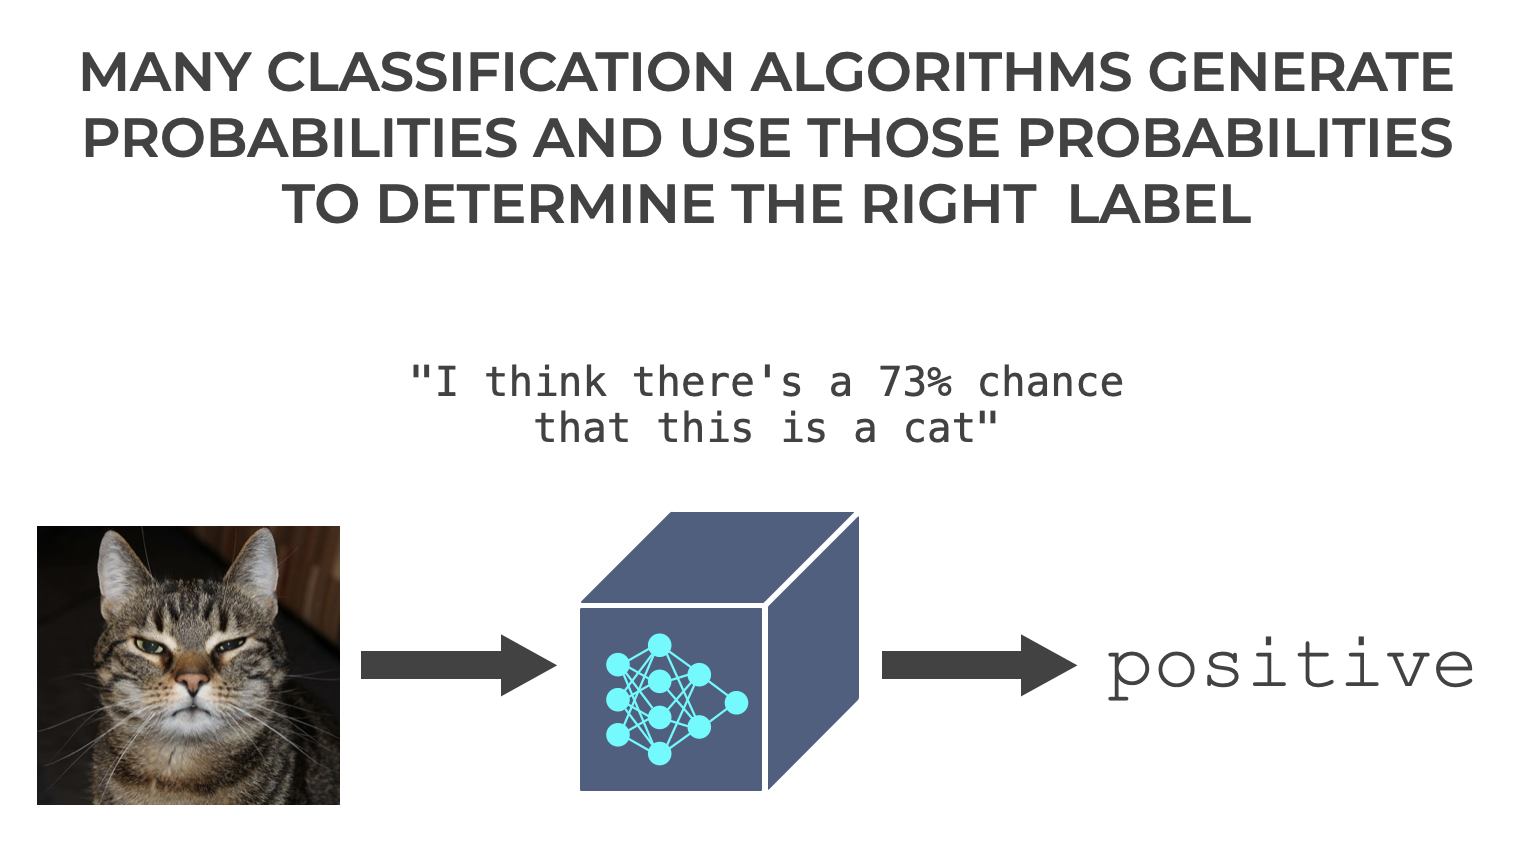
You can almost imagine the machine learning system saying “I think there’s a 73% chance that this is a cat.” (Although to be clear, ML systems have no internal monologue. Don’t be foolish.)
Many types of machine learning classification systems work this way. Probabilistic classifiers include:
- logistic regression
- neural networks
- certain ensemble methods like gradient boosting
These all generate a probability score and use that probability score to indicate how likely it is that the example at hand belongs to the positive class.
The Classification Threshold
As I explained this to you, you might have realized something:
The probability score that these classification systems create is only useful in comparison to a cutoff point.
Said differently, where’s the cutoff point for determining if an example is positive? If the classifier predicts that there’s a 51% chance that the example is positive, is that enough? Do we want the cutoff point to be higher?
Well, that’s where the classification threshold comes in.
The classification threshold is a cutoff point that we use for determining if the example will be labeled positive:
- If the probability score is greater than the threshold, then output
positive. - If the probability score is less than or equal to the threshold, then output
negative.
It’s literally the threshold that enables the model to take the set of possible probability scores and translate them into either positive or negative classification labels.
Example: logistic regression
Let’s look at an example.
Perhaps the simplest and traditionally one of most common machine learning classification algorithms is logistic regression.
Logistic regression is really just a mathematical function (although technically, almost all machine learning algorithms produce functions of one type or another).
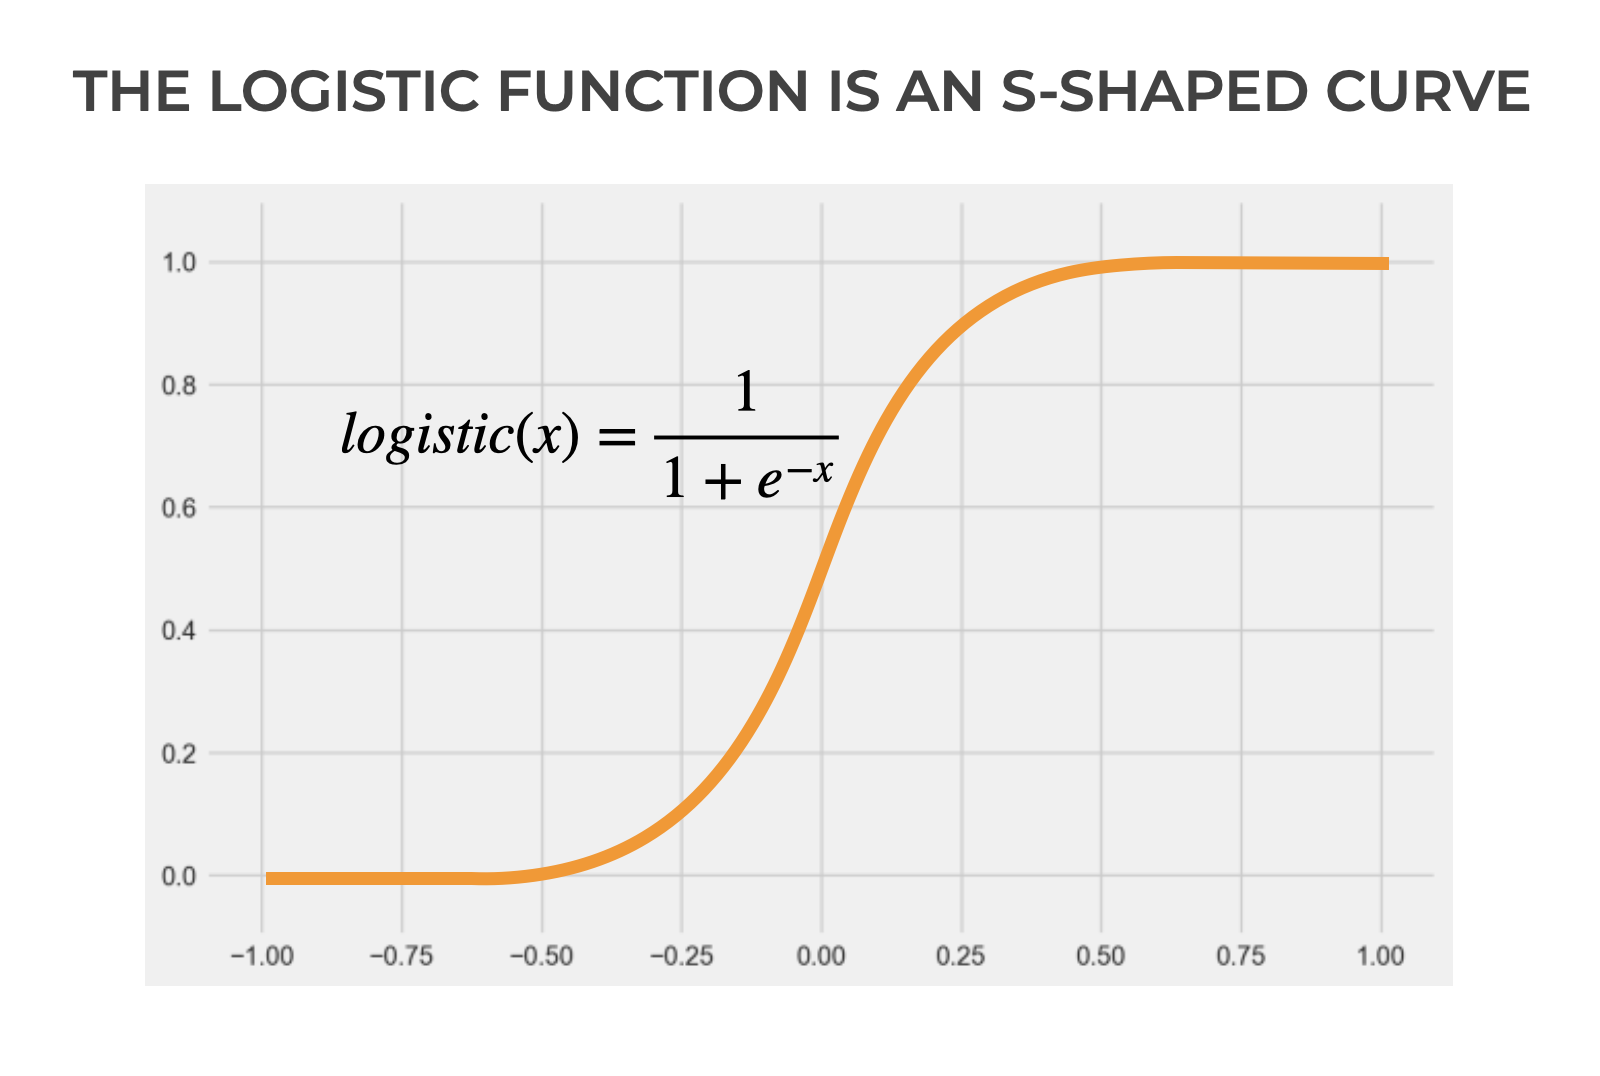
The function itself is just an S-shaped curve, which is described by this equation:
(1) 
Seem complicated?
It’s not, really.
It’s just a particular type of S-shaped curve.
Here’s the thing: it works really well for binary classification problems.
Why?
Look at how it’s structured.
As  increases,
  approaches 1.
And as decreases, approaches 0.
Additionally, there’s a relatively steep transition between these two in the middle (around 0 in the basic logistic function show above).
The function has a strong tendency towards either 0 or 1.
Which makes it great for binary classification.
Having said that, when you use logistic regression, there’s always a classification threshold.
Logistic Regression as a Binary Classifier
To understand how such a threshold works, let’s take a look at an example.
Let’s say that we have a dataset with positive examples and negative examples.
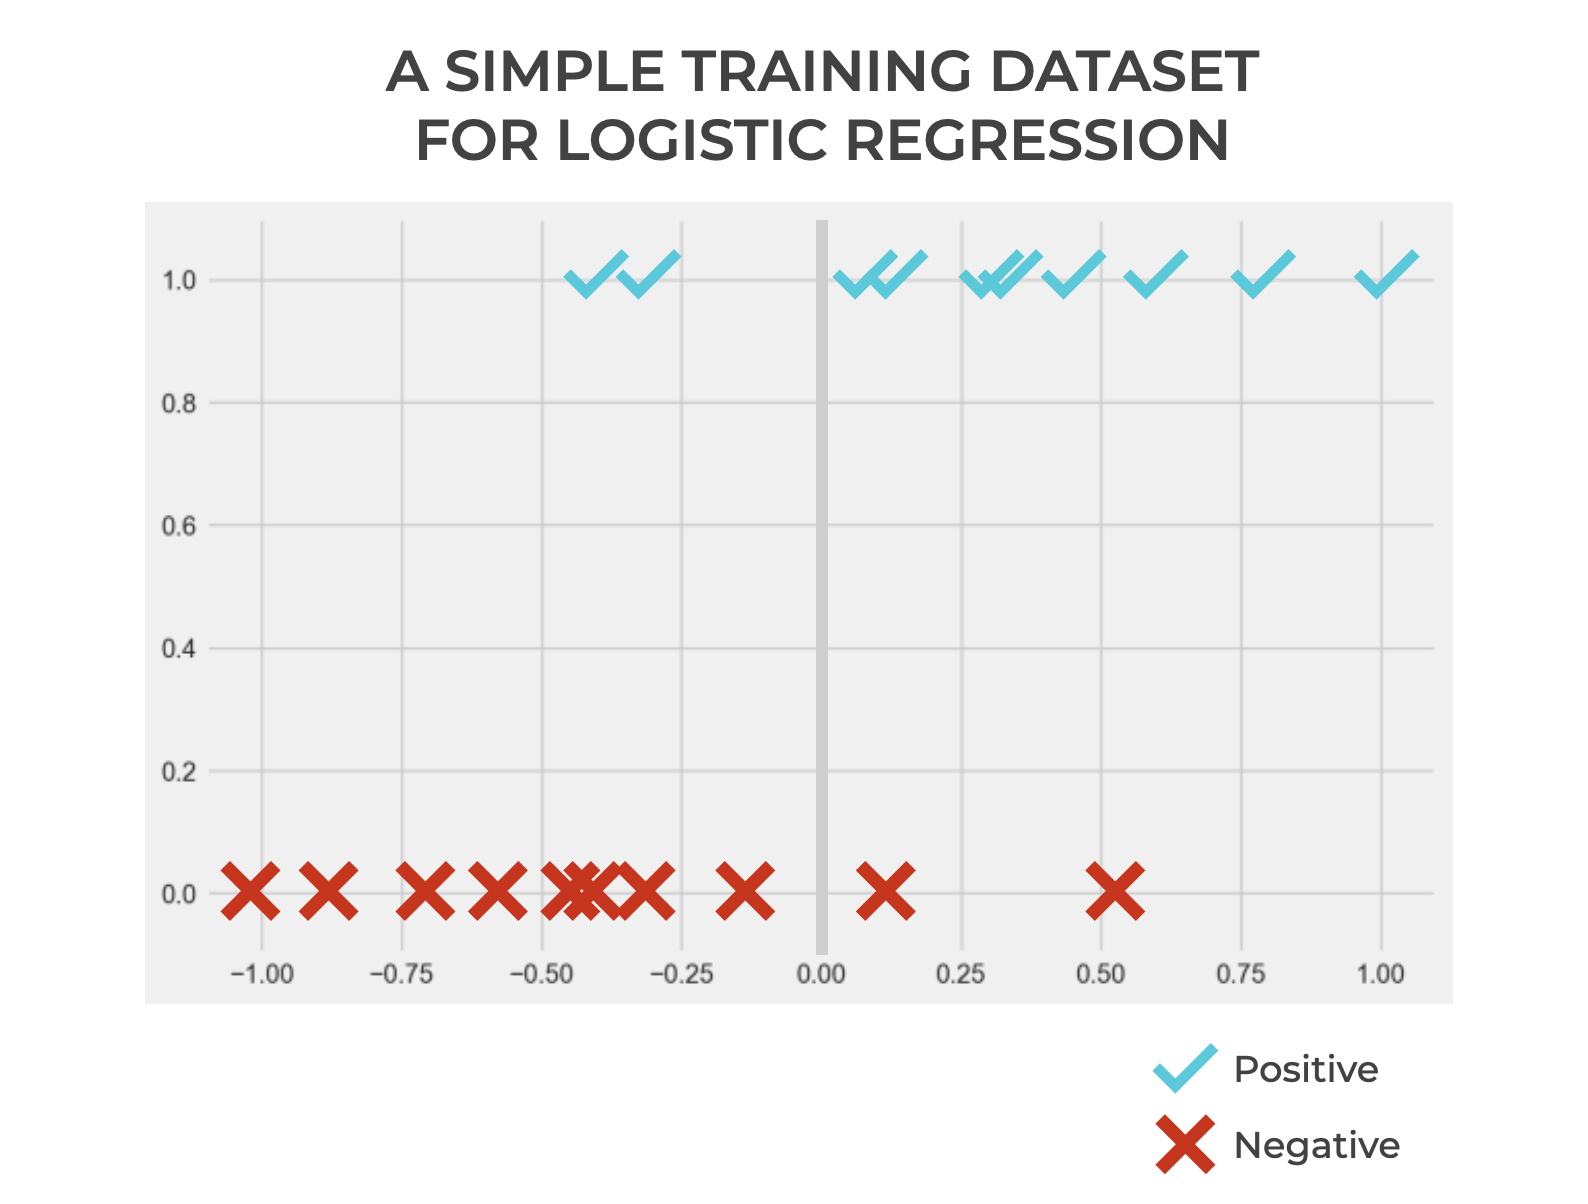
Remember: when we train a machine learning model, we already know the so-called “target” value. So in the context of classification we know which values are positive and negative when we train the model. BUT, we want to build a model that’s capable of accurately predicting the correct label.
So let’s assume that we want to build a logistic regression model on the basis of this training data.
What does that look like?
Logistic regression models the relationship between (the input) and  (the target/output) as an s-shaped curve.
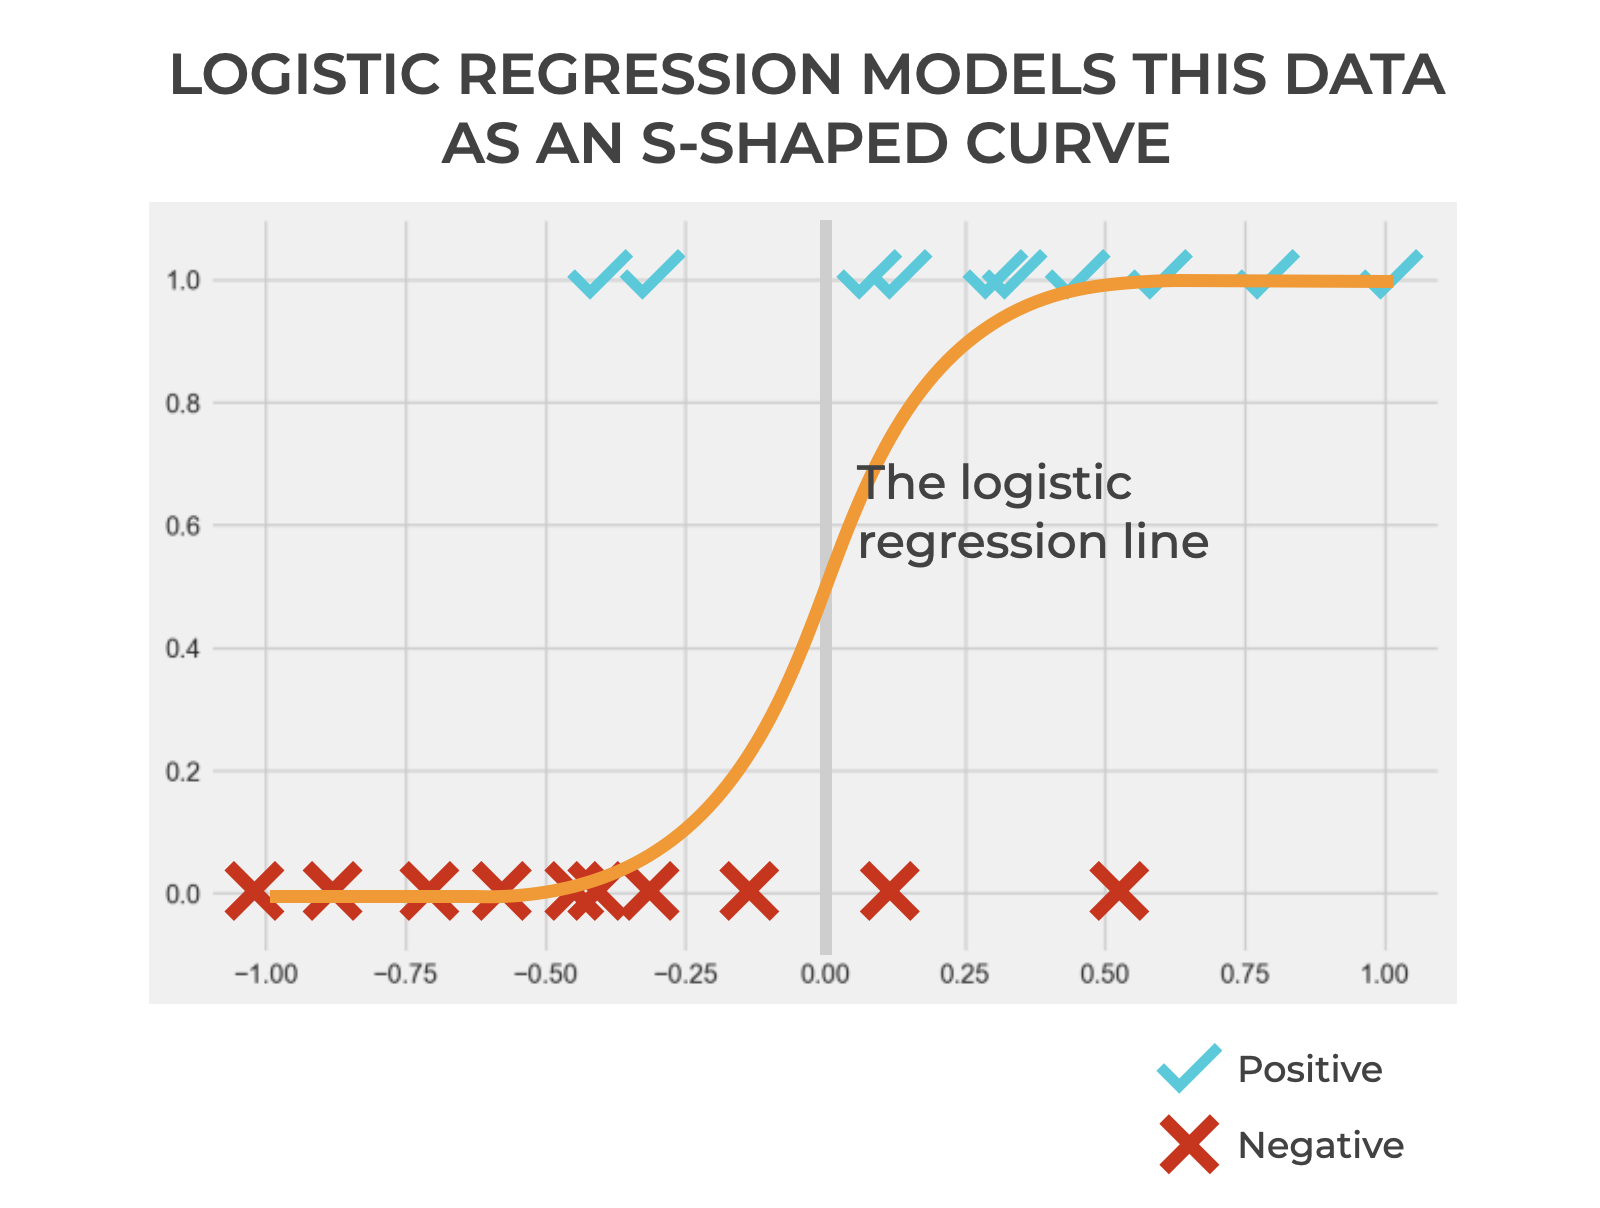
And what does the curve represent?
The value of the curve (i.e., the y-axis value of the logistic regression function, at any point) represents the probability of the positive class.
Now, it’s important to remember that we could use any function to model these training observations. It’s just that these data are clearly binary, and a logistic regression curve fits pretty well.
The “Threshold” of Our Logistic Regression Model
At this point, you might be wondering …
Where does this “threshold” thing come in?
Very good question, Chad.
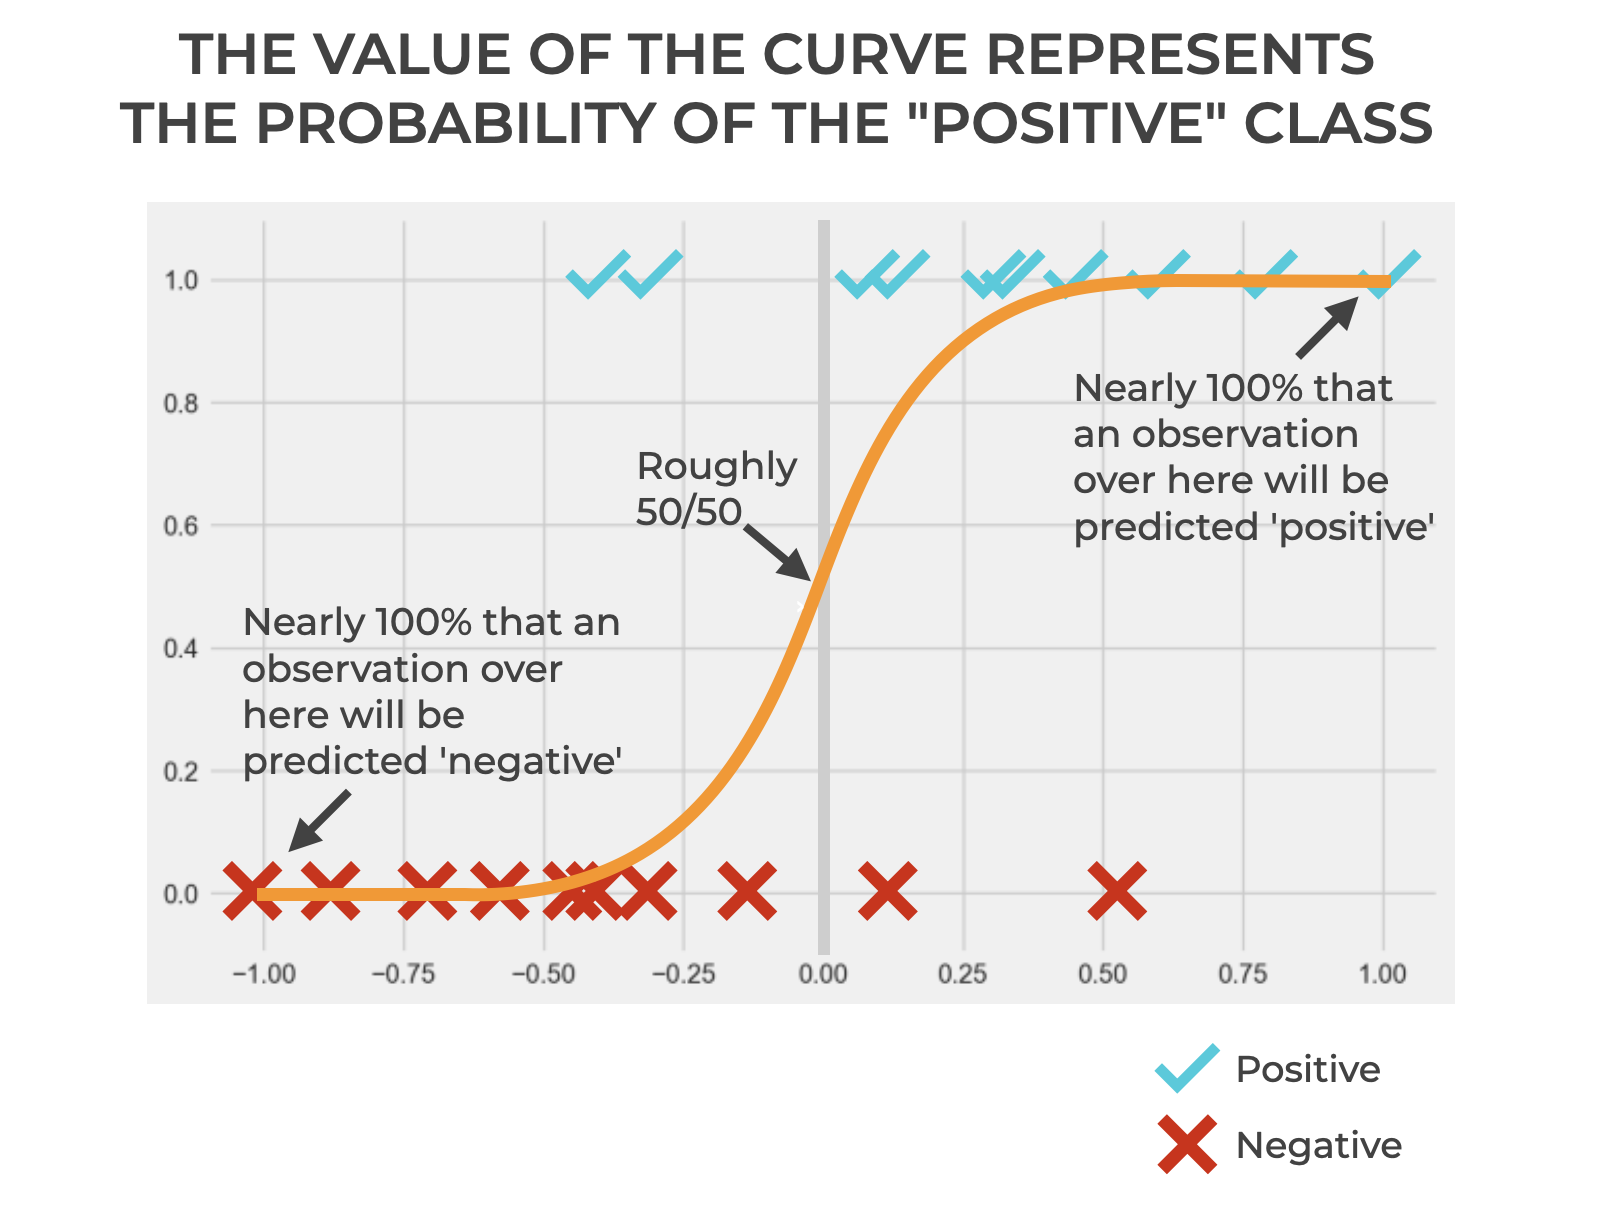
Remember what I just said: logistic regression models the data as an s-shaped curve, and the y-axis value of that curve represents a probability.
The probability is the probability that an observation is “positive”.
But, a probability is just a number.
If we’re doing classification, we need our model to output a categorical label.
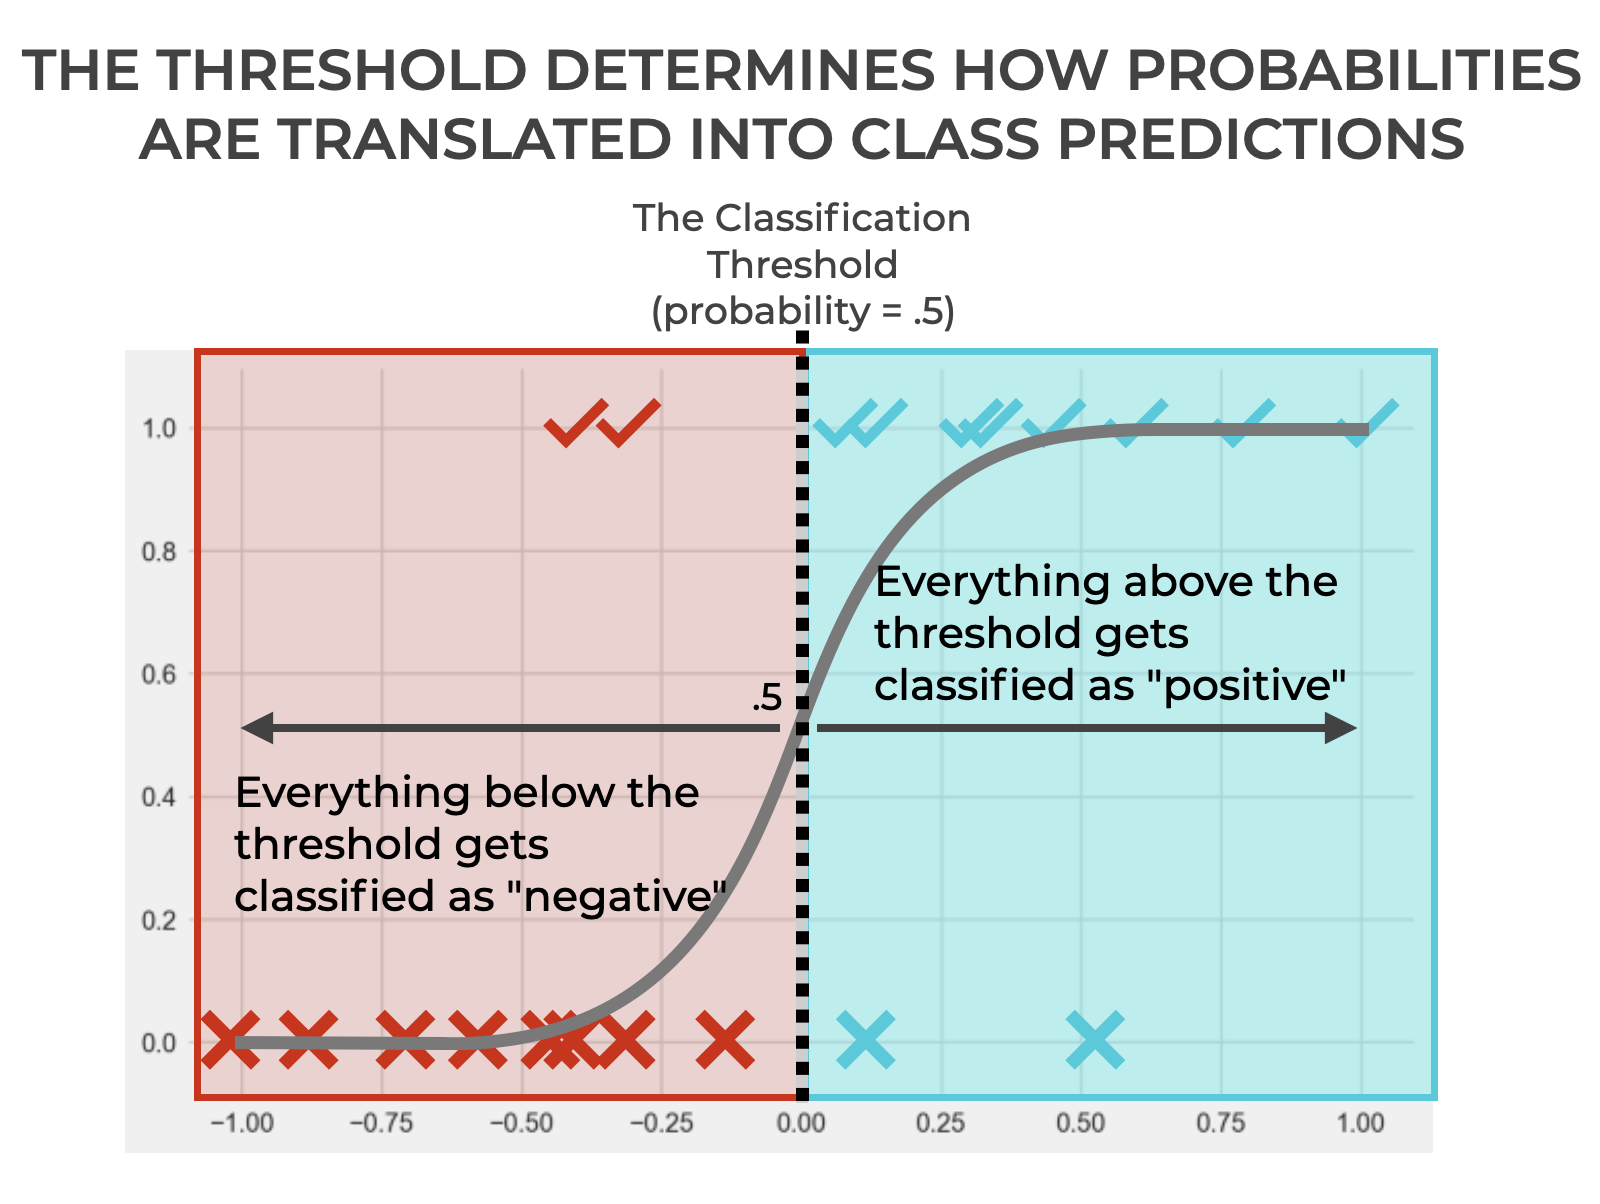
And that’s where the threshold comes in.
The threshold is a boundary … a dividing line.
… above which the model outputs positive.
… and below which the model outputs negative (or if the value is equal to the boundary value).
The threshold is a dividing line that enables us to translate the numeric probability (i.e., the probability score) of our logistic regression curve into a binary, categorical label.
If you’re paying attention, you might notice a problem in the image.
We’re classifying everything above the threshold as positive and classifying everything below (or equal to) the threshold as negative.
BUT, look carefully.
That means that some examples that are actually positive (✓s) have been classified as negative (False Negatives).
And there are some examples that are actually negative (Xs) that have been classified as positive (False Positives).
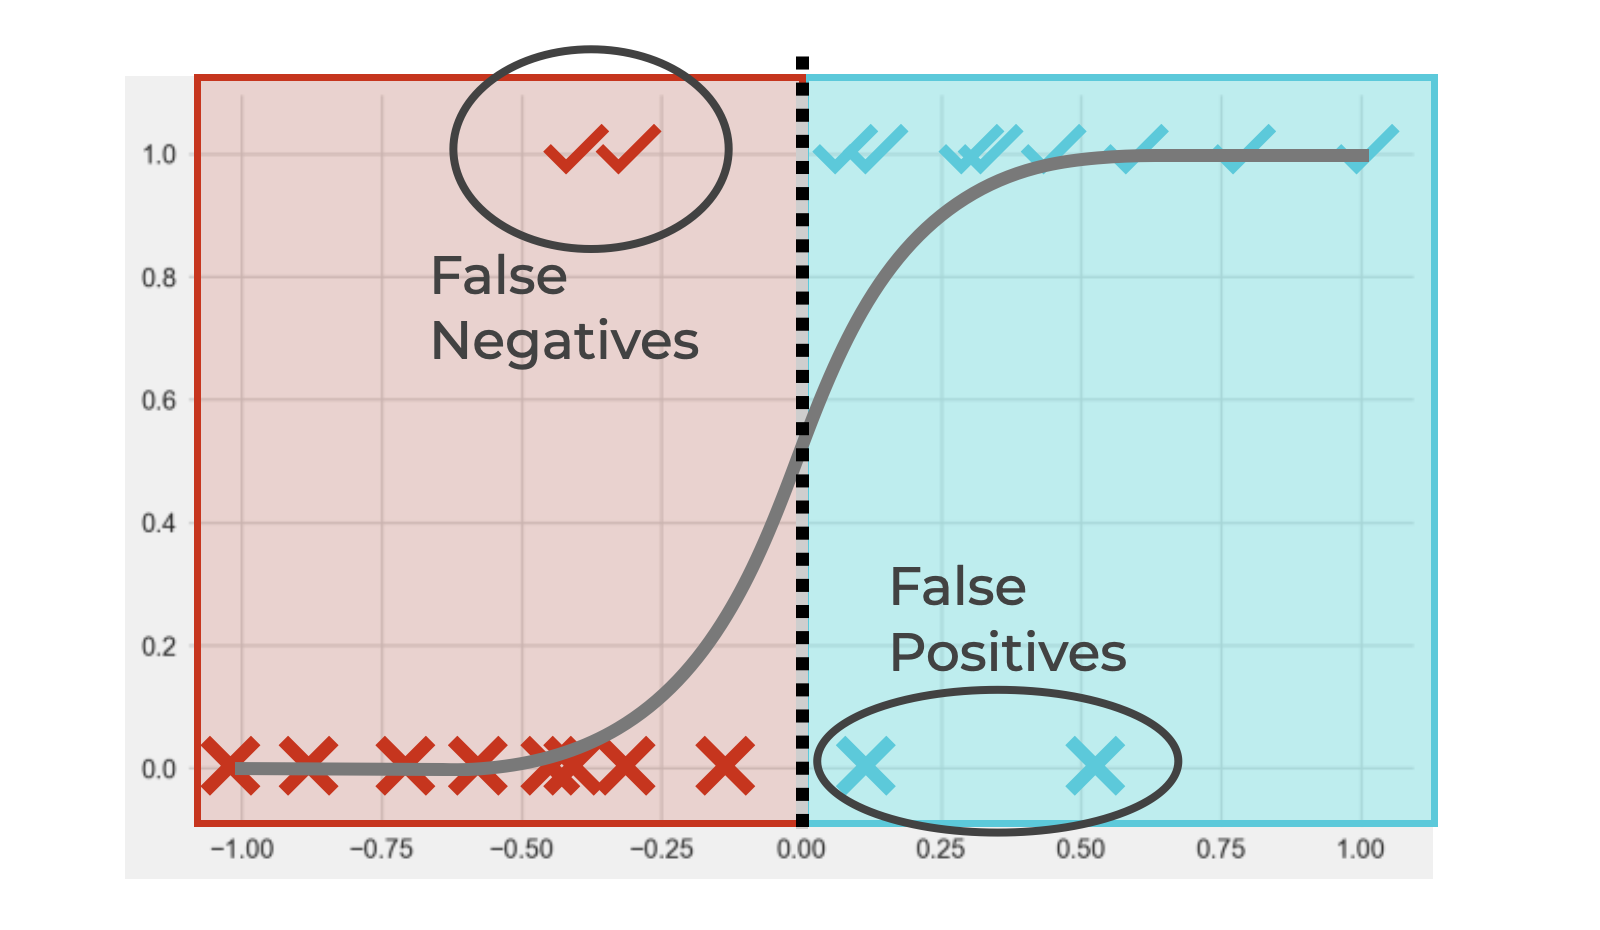
This is a very common problem in classification, and is in fact, at the core of classification performance. We’re always trying to minimize False Positives and False Negatives (although, in many tasks, one or the other may be more of a priority).
I’m going to set aside a broader discussion of False Positives and False Negatives for now, but I recommend that you read our tutorial on False Positives or our tutorial on False Negatives for more information.
You Can Change the Threshold
Next, we’ll complicate things a bit.
We’ll change the threshold.
Yes.
You can actually do that. And it’s really important for how classifiers work.
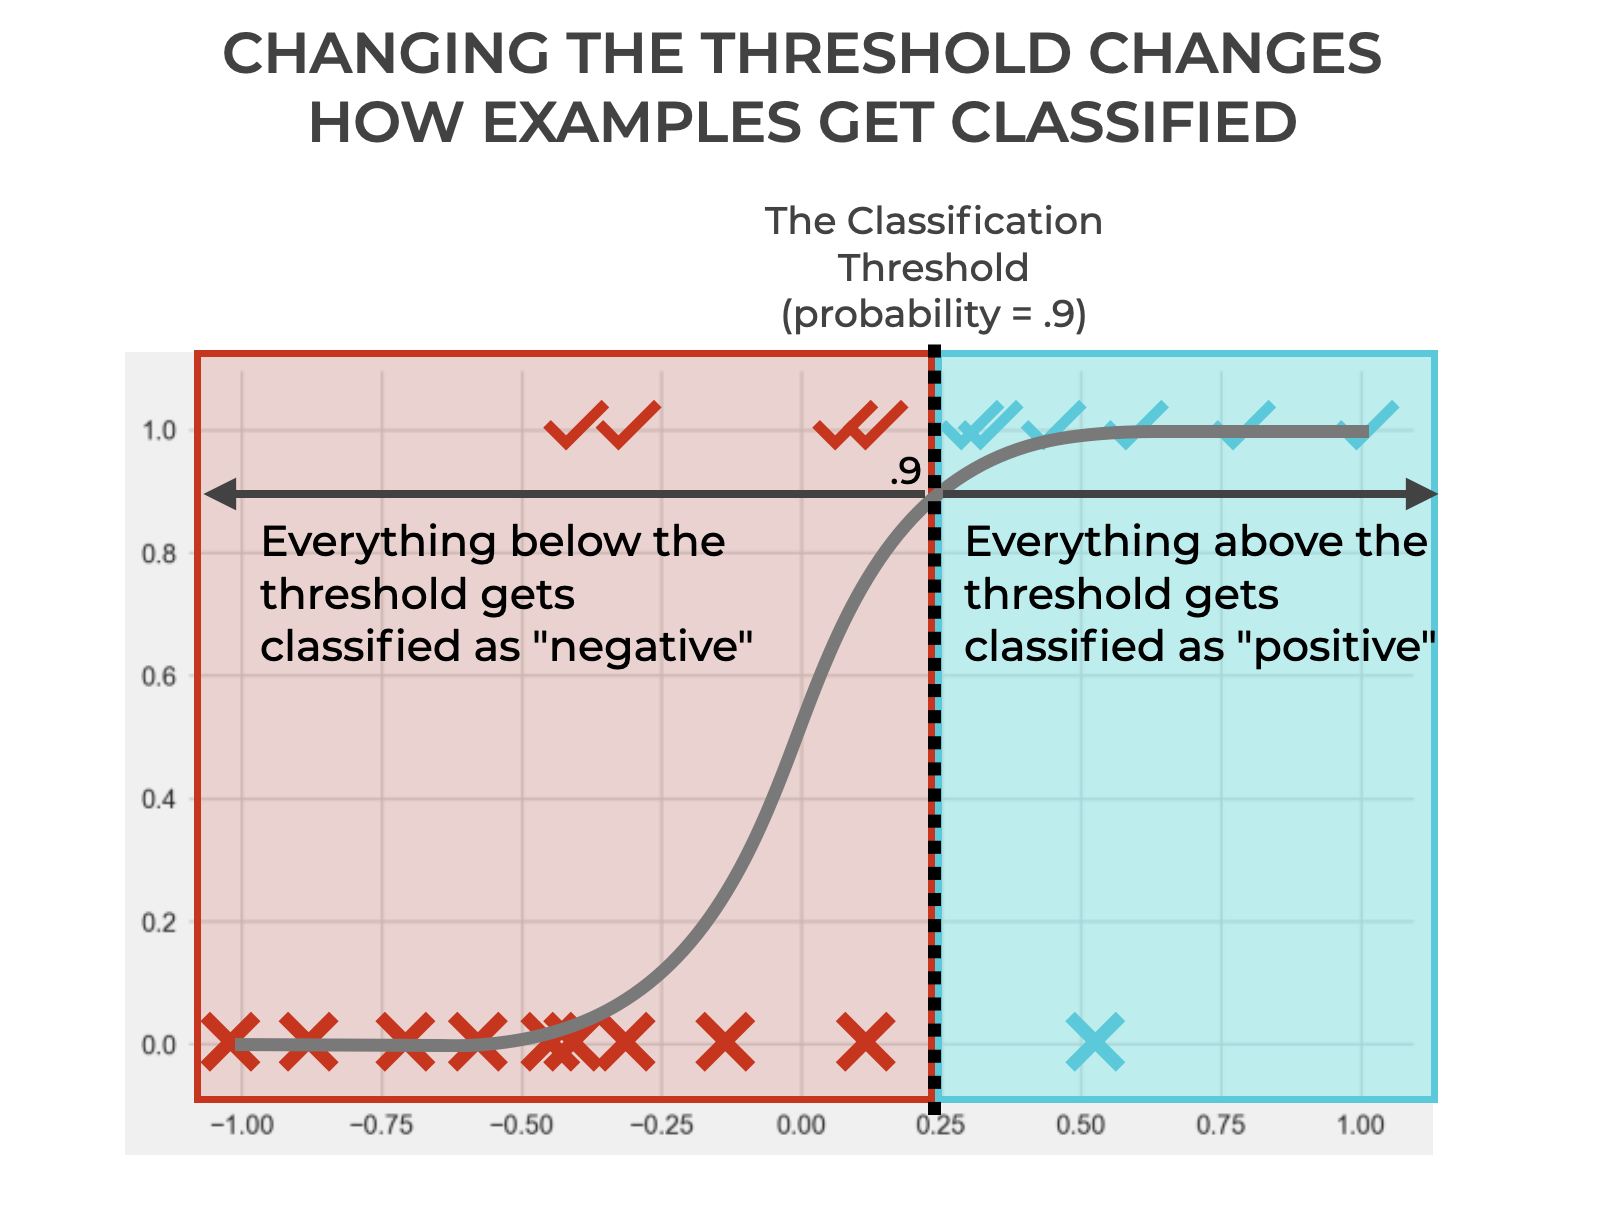
In this case, we’ve increased the threshold from .5 to .9.
Doing this has increased the number of True Negatives and decreased the number of False Positives.
But it’s also decreased the number of True Positives and increased the number of False Negatives.
So if we’re concerned with decreasing False Positives, this was probably a good move. But if we’re concerned with having as many True Positives as possible, it might be bad.
Ultimately, what I want you to see is that changing the threshold changes how the classifier classifies observations.
It’s like this for our simple example with logistic regression, but it’s basically true with all classifiers that generate probability scores and have a probability threshold.
Changing the classification threshold changes how the classifier classifies observations.
How Classification Threshold Changes Classification Metrics
In the previous section, I noted that the location of the threshold impacts the number of True Positives and True Negatives, as well as the number of False Positives and False Negatives.
If you know anything about classification metrics, you’ll realize that changing the numbers of TP, TN, FP, and FN will result in changes in classification metrics.
That’s because almost all classification metrics and classification evaluation tools are downstream of the numbers of TP, TN, FP, and FN.
This is somewhat of a big subject, so it’s probably best if I write a much longer blog post on the topic another time.
But briefly, let’s review how changing classification threshold changes classification metrics.
True Positive, True Negative, False Positive, False Negative
I touched on this briefly above, but I’ll reiterate here.
Increasing the classification threshold decreases True Positives AND False Positives. Increasing the threshold also increases True Negatives and False Negatives. Increasing the classification threshold amounts to being more conservative in how/when you classify an example as positive.
Conversely, decreasing the threshold loosens up the condition for classifying an example as positive; the model will become more liberal in classifying examples as positive. So, when you decrease the threshold, the model will predict more positives overall. That means, when you decrease the threshold, the model will generate more True Positives as well as more False Positives. But at the same time, True Negatives and False Negatives will decrease.
In turn, these changes will be seen in the confusion matrix, which visualizes TP, TN, FP, and FN in a 2×2 grid.
Precision
Precision is the proportion of positive predictions that are actually positive.
Precision is defined as follows:
(2) 
Increasing classification threshold causes the model to be much more conservative in how it predicts positive. So the model will require a much higher probability score for positive and will only predict an example as positive when it’s very certain that the prediction will be correct. This tends to decrease False Positives, which in turn, increases precision.
Conversely, decreasing the threshold causes the model to be less conservative in how it predicts positive. In this case will be much more liberal in predicting examples as positive. This will increase False Positives, which in turn, decreases precision.
Recall
Recall is the proportion of all positive examples that are correctly predicted as positive, and is defined as follows:
(3) 
As noted above, increasing the classification threshold will cause the model to be much more conservative in how it predicts positive. While this will decrease the number of False Positives, it will, at the same time, increase the number of False Negatives. Because the denominator of recall is influenced by the number of False Negatives, as FNs increase, recall will decrease. So increasing the threshold will actually decrease recall.
On the other hand, decreasing the threshold will cause the model to be less conservative in how it predicts positive. This will decrease False Negatives, which in turn, increases recall. So as threshold decreases, recall increases.
F1 Score
F1 score is the harmonic mean of precision and recall, and can be computed as:
(4) 
In terms of True Positive, False Positive, and False Negative, this simplifies to:
(5) 
Because F1 score harmonizes between both precision and recall, and because it takes into account both False Positives AND False Negatives, the relationship between F1 and classification threshold is much more nuanced.
Although there are tasks for which you want to strictly optimize for either precision or recall, F1 score is often better than precision or recall alone. Having said that, finding the best threshold to optimize the F1 score of a particular classifier is more difficult, and often requires calculating the model’s F1 across a range of thresholds to find the best F1 score empirically.
Wrapping Up: Why Classification Threshold is Important
In this post, I’ve tried to explain as clearly as possible what classification threshold is and how it works.
Ultimately, the threshold is just a cutoff that we use to evaluate the probability score generated by a classification model. Although some classification algorithms do not produce a probability score (and for those algorithms, the threshold is inapplicable), many classifiers do produce probabilistic scores for every example. That is, many important algorithms – like logistic regression, many neural network classifiers, and many ensemble classifiers – do work probabilistically, and therefore do use a classification threshold.
So, you need to know this. It’s a very important concept, whether you’re just getting started with machine learning classifiers (e.g., with logistic regression) or if you’re doing advanced classification tasks, like computer vision with convolutional neural networks.
Classification threshold is an extremely important concept for classification, machine learning, and modern AI.
Leave your Questions Below
Are you still struggling to understand classification thresholds?
Is there something that I left out that you want to know?
Tell me …
Leave your questions, concerns and comments in the comments section at the bottom of the page.
Sign up for our email list
If you want to learn more about machine learning and AI, then sign up for our email list.
Every week, we publish free long-form articles about a variety of topics in machine learning, AI, and data science, including:
- Machine Learning
- Deep Learning
- Scikit Learn
- Numpy
- Pandas
- Keras
- … and more
When you sign up for our email list, then we’ll deliver those tutorials to you, free, and direct to your inbox.
Hi!
I am very interested in multi-class classificaton or/and multinomial regression. How can the theory be generalized to this problem. What kind of metrics can be calculated and how and what can be the threshold replaced with?
In case of regression the estimates are probabilities for each class, that is a predicted discrete distribution. If I use the mode of this distribution as the predicted class then the low probability classes would never been chosen even they are present in the data.
I would use instead a one-item random sample from this predicted distribution as the predicted class. Is that a good approach?
I’m going to write more about multi-class classification elsewhere.