In this tutorial, I’ll show you how to use the Sklearn predict method to predict outputs using a machine learning model in Python.
So I’ll quickly review what the method does, I’ll explain the syntax, and I’ll show a example of how to use the technique.
If you need something specific, just click on the appropriate link here. The link will take you to the specific section of the tutorial.
Table of Contents:
A Quick Introduction to Sklearn Predict
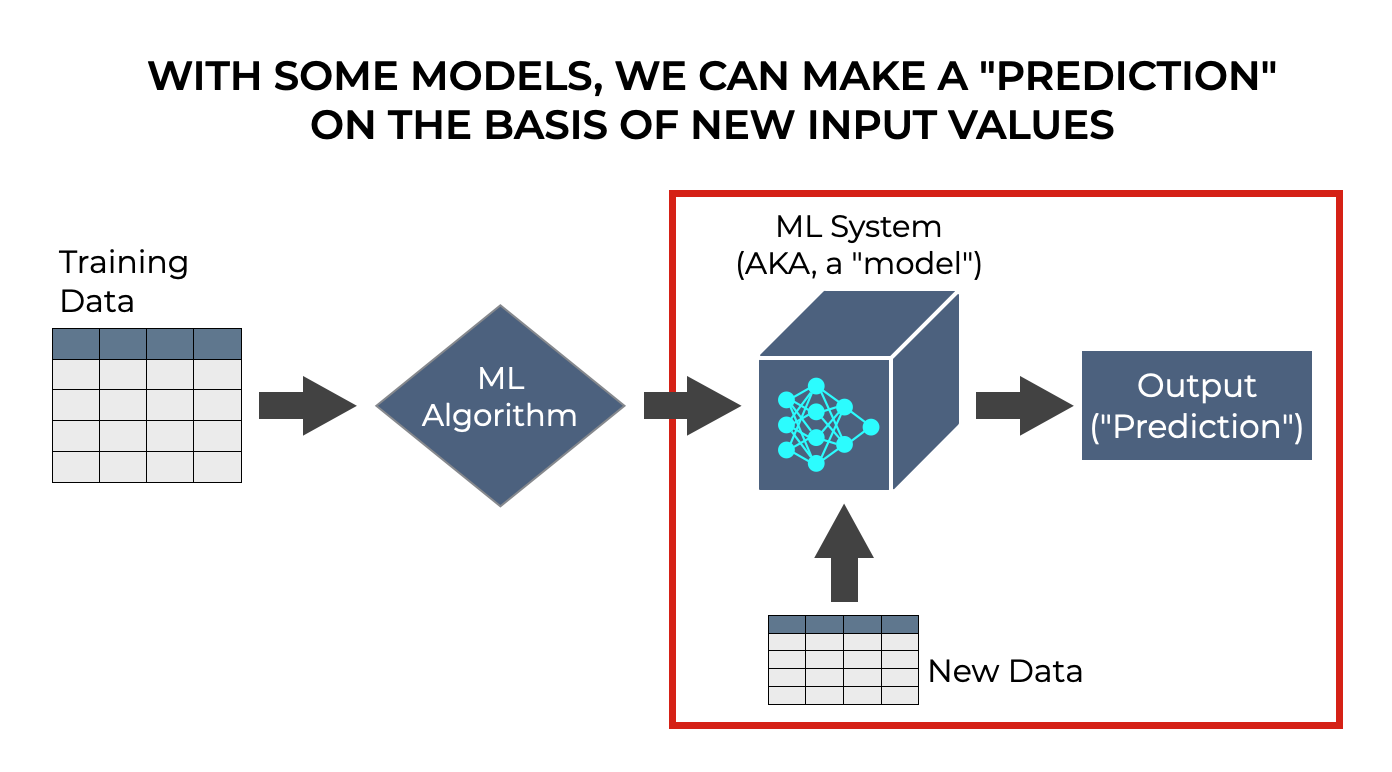
To understand what the Sklearn predict method does, you need to understand the overall machine learning process.
Creating and using a machine learning model has several phases, but we can break it down into two major steps:
- train the model
- use the model
Of course, it’s a little more complicated than that. We often need to evaluate the model, or make little changes or modifications.
But at a very high level, we first train the model and then we can use the model to do things.
Frequently, we use the model to make predictions about outputs, given new inputs.
Many machine learning models “predict” new output values
Once trained, many machine learning models are primarily used to make predictions.
We predict an output value, given a set of input values.
So for example, let’s say that we have a model that predicts housing prices. The inputs (often called the features), might be things like zip code, square footage, the number of rooms, the number of bathrooms, and a variety of other things about the houses.
If we have such a model that’s already been trained, then we can provide new input data, and the model should produce an output. It makes a “prediction” about the house price, based on the input data.
Many machine learning algorithms work like this. We can use machine learning systems make predictions about things like:
- predicting if a person will respond to a marketing campaign
- predicting if an email message is a “spam” message
- predicting if an input image is a cat or a dog
For many machine learning systems, including regression and classification systems, the task involves making a prediction of some kind.
The Sklearn ‘Predict’ Method Predicts an Output
Now, let’s bring this back to scikit learn.
Scikit learn is a machine learning toolkit for Python.
That being the case, it provides a set of tools for doing things like training and evaluating machine learning models.
And it also has tools to predict an output value, once the model is trained (for ML techniques that actually make predictions).
That’s essentially what the predict() method does. Once the model is trained, we can use predict() to predict an output value, on the basis of input values.
The Syntax of the Sklearn Predict Method
Now that we’ve discussed what the Sklearn predict method does, let’s look at the syntax.
One reminder: this syntax explanation here assumes that you’ve imported scikit-learn and that you’ve initialized a model, such as LinearRegression, RandomForestRegressor, etc.
Sklearn ‘Predict’ syntax
When we call the predict method, we need to call it from an existing instance of of a machine learning model that’s already been trained with training data. For example, LinearRegression, LogisticRegression, DecisionTreeRegressor, SVM are all valid machine learning model types in scikit learn.
After you’ve initialized and trained the model, you can call the predict method using “dot” syntax:
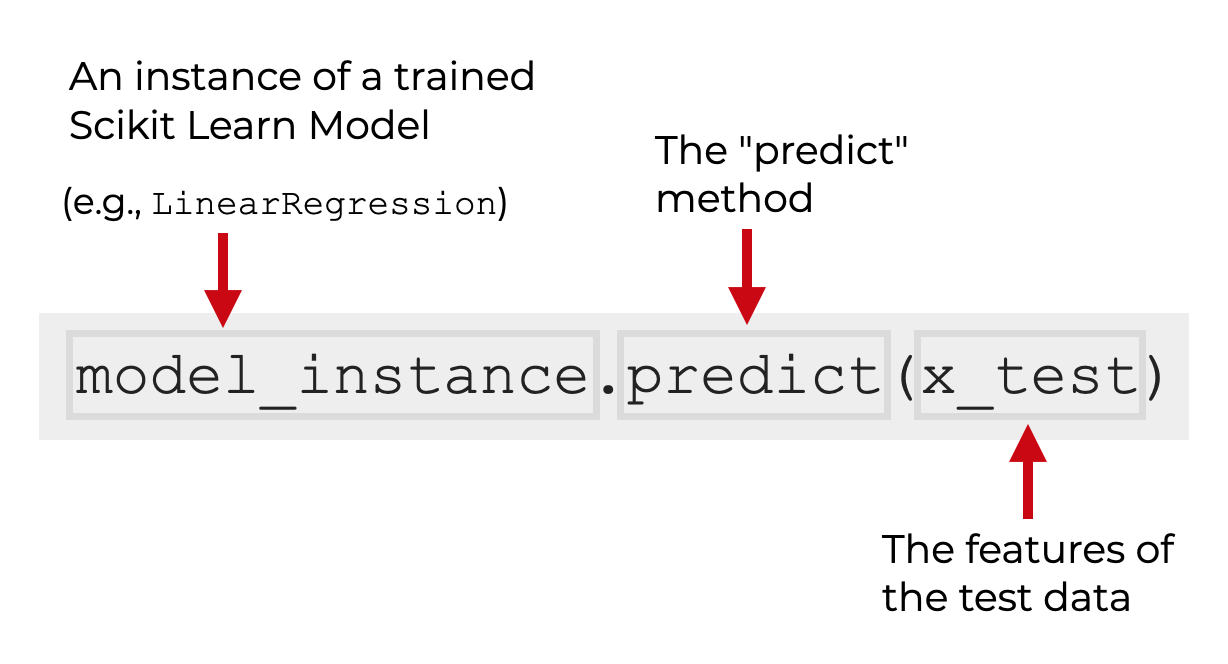
Inside the parenthesis of the method, you provide the name of the new input data (i.e., the features of the test dataset. This dataset is commonly called X_test.
So for example, let’s say you’re you’re doing ordinary linear regression with an instance of the LinearRegression. You’ve instantiated the model with the name my_linear_regressor, and you’ve trained the model using the Sklearn fit method.
To then make a new prediction, you could use the code:
my_linear_regressor.predict(X_test)
It’s pretty simple.
The format of the input data
One last note before we move on.
The input to the predict() method – the X test data – needs to be in a 2-dimensional format. For example, it should be in a 2-dimensional numpy array.
If your X_test data is not in a 2D format, you might get an error. In that case, you’ll need to reshape the X_test data to 2 dimensions.
(I’ll do this in the upcoming example.)
Example: How to Use Sklearn Predict
Now that we’ve examined how the syntax works, let’s work through an example of how to use Sklearn predict.
In this example, I’ll show you how to use a machine learning model to make a “prediction.” This of course assumes that we’ve trained the model, so we’ll need to train the model first.
All that being said, there are several steps to this example.
Steps:
Run Setup Code
Before we fit initialize, fit, or predict, we need to run some setup code.
We need to:
- import scikit-learn and other packages
- create a training dataset
- initialize a model
Let’s do all of those.
Import Scikit Learn and other packages
First, let’s import the packages that we’ll use.
We’re going to import Scikit Learn, Numpy, and Seaborn:
import sklearn
import numpy as np
import seaborn as sns
We’ll use Numpy to create a mock train/test dataset. We’ll use Seaborn to visualize the data. And obviously, we need Scikit Learn to actually built, fit, and predict with a model.
Create Training Data
Now, we’ll create a dataset that we can use.
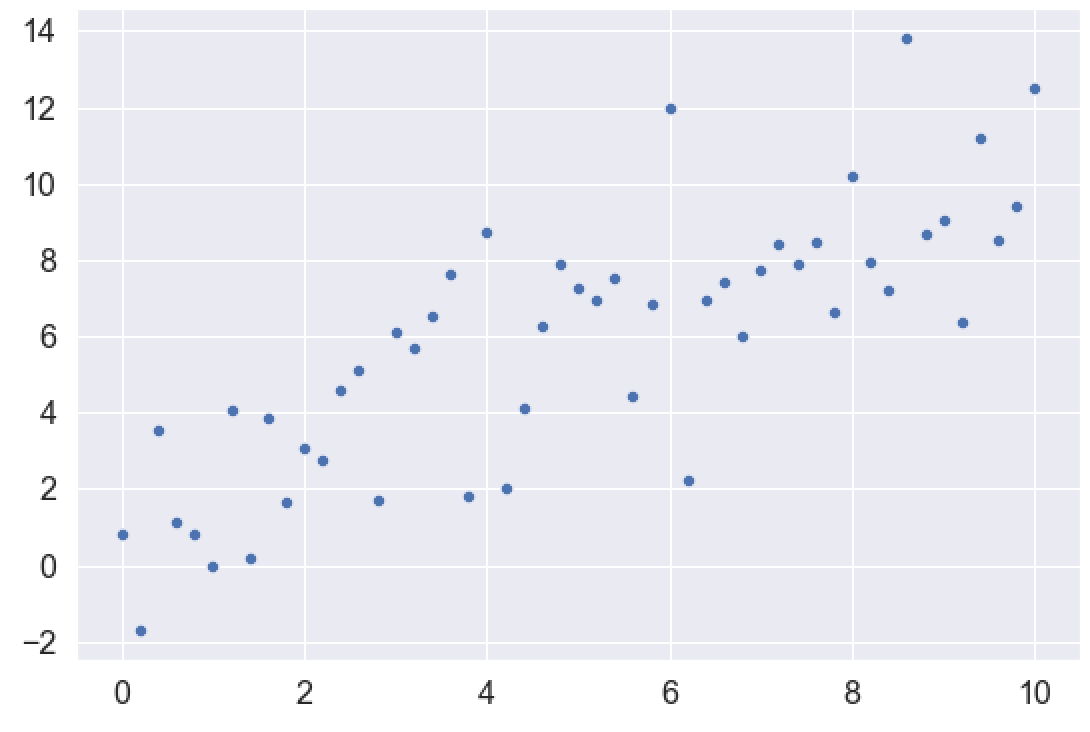
Specifically, we’re going to create a dataset that’s roughly linear, with a little noise built in to the y-values.
To do this, we’ll use Numpy linspace and Numpy random normal.
Numpy linspace will create an evenly distributed x-axis variable.
And we’ll create a y-axis variable that’s linearly related to the x-axis variable, but we’ll add in some random normal noise with Numpy random normal. Note that we’ll also use Numpy random seed to set the seed for the random number generator.
observation_count = 51
x_var = np.linspace(start = 0, stop = 10, num = observation_count)

np.random.seed(22)
y_var = x_var + np.random.normal(size = observation_count, loc = 1, scale = 2)
Once you run that code, you’ll have two variables:
- x_var
- y_var
We can plot the data with Seaborn:
sns.scatterplot(x = x_var, y = y_var)
OUT:
Split data
Now, let’s split our data into train and test data, using the train-test split function from scikit learn.
from sklearn.model_selection import train_test_split
(X_train, X_test, y_train, y_test) = train_test_split(x_var, y_var, test_size = .2)
This gives us 4 datasets:
- training features (X_train)
- training target (y_train)
- test features (X_test)
- test target (y_test)
Initialize Model
Next, we’ll initialize a model object.
In this example, we’ll use LinearRegression from Scikit Learn.
from sklearn.linear_model import LinearRegression
linear_regressor = LinearRegression()
After you run this, linear_regressor is an Sklearn model object. With that model object, we can call the fit method, and then the predict method.
Fit the Model
Let’s now fit the model on the training data.
linear_regressor.fit(X_train.reshape(-1,1), y_train)
In this code, we’re fitting our linear regression model on the training data, X_train and y_train.
(Note: X_train has been reshaped into a 2-dimensional array. The fit method and predict method expect 2D input arrays.)
Predict
Now that we’ve trained our regression model, we can use it to predict new output values on the basis of new input values.
To do this, we’ll call the predict() method with the input values of the test set, X_test. (Again: we need to reshape the input to a 2D shape, using Numpy reshape.)
Let’s do that:
linear_regressor.predict(X_test.reshape(-1,1))
OUT:
array([2.68333959, 7.55665544, 2.35845187, 8.20643088, 9.34353791,
       5.76977296, 8.69376247, 2.84578345, 5.6073291 , 3.98289048,
       4.79510979])
So here, the model has predicted output y-axis values, on the basis of the input x-axis values in X_test.
We can then compare these values to the actual values to see how the model performs.
Leave your other questions in the comments below
Do you have other questions about the Sklearn predict method?
Is there something that I’ve missed?
If so, leave your questions in the comments section near the bottom of the page.
For more machine learning tutorials, sign up for our email list
In this tutorial, I’ve shown you how to use the Sklearn predict method.
But if you want to master machine learning in Python, there’s a lot more to learn.
That said, if you want to master scikit learn and machine learning in Python, then sign up for our email list.
When you sign up, you’ll get free tutorials on:
- Scikit learn
- Machine learning
- Deep learning
- … as well as tutorials about Numpy, Pandas, Seaborn, and more
We publish tutorials for FREE every week, and when you sign up for our email list, they’ll be delivered directly to your inbox.