When you begin immersing yourself in the world of classification systems, you’ll encounter a large number of different classification metrics: precision; recall; accuracy; sensitivity and specificity; F1-score; and many more.
But as you begin digging into these metrics you’ll find another quantity that underpins them all: true positives.
To understand classification generally as well as how to build classification systems, you need to understand what True Positives are.
So in this blog post, I’m going to explain what True Positives are and why it’s so important to classification and classification metrics.
If you need something specific, you can click on any of these following links. The link will take you to the specific location in the blog post.
Table of Contents:
- What are True Positives
- Why are True Positives Important in Classification
- Pitfalls, Caveats, and Other Considerations
- Frequently Asked Questions
Having said that, this is largely a conceptual blog post, and you’ll probably understand the concept of True Postives better if you read the whole thing from start to finish.
With all of that said, let’s start learning about True Positives.
What is a True Positive?
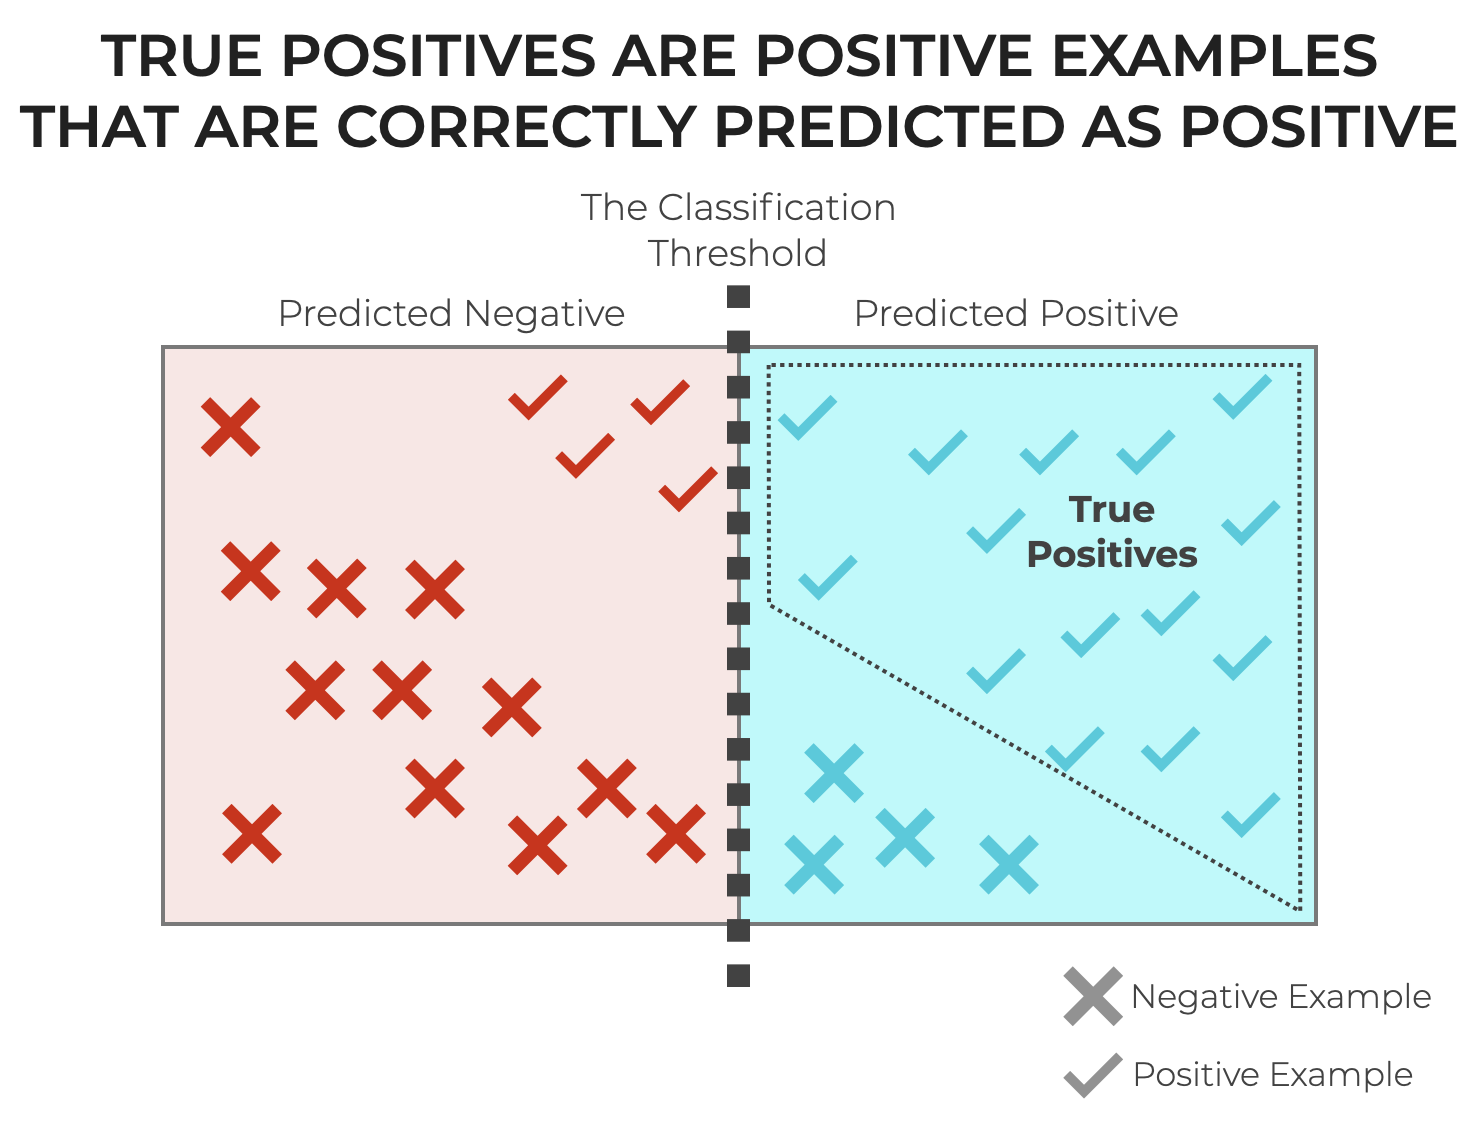
In the simplest terms, a True Positive (TP for short) is a case where a classification system correctly predicts a positive class.
In other words, the model predicts that the example is positive, and it’s actually positive!
To make sure that that makes sense though, let’s quickly review some of the key concepts like classification, as well as positive and negative.
Classification Systems Predict Categories
You might recall from my blog post about Regression vs Classification that, classifiers (i.e., classification models) predict categorical classes on the basis of input data.
So a fully trained classification model takes in input data (commonly called feature data) and it outputs a categorical class, which is often called a label.
These categorical labels can be essentially anything, but in the binary context, we commonly have labels such as:
TrueandFalse1and0SpamandNot Spam(i.e., in a email spam detector)
… just to name a few.
The exact encoding of the output labels can be arbitrary and it typically depends on the problem being solved.
But in general for binary classification, we can simplify all of these labeling schemes into a more generalized encoding.
Positive and Negative are General Binary Labels
Instead of the specific labels described above like True and False or Spam and Not Spam, we can simplify these labeling schemes into something much more general: Positive and Negative.
So for example, in the case of an email spam detection system (a commonly seen classification system, the model would predict as follows:
- Predict
Positiveif it thinks that the email is spam. - Predict
Negativeif it thinks that the email is not spam.
And it generalizes to many other types of classifiers.
If we have a cancer detection system, it could predict Positive if it thinks that the a person has cancer, and predict Negative if it thinks that the person does not have cancer.
This generalized Positive/Negative label encoding scheme is important, because it lays the foundation for the terminology that we use to talk about the term True Positive, as well as the associated terms True Negative, False Positive, and False Negative.
Why are True Positives Important?
You need to understand True Positives for a few different reasons,
- It’s an index of a model’s ability to classify positive cases.
- It’s the basis for other metrics and evaluation tools.
- It ultimately helps with classifier evaluation.
Let’s quickly talk about each of these.
Index of Model’s Ability To Classify Positive Cases
Perhaps the most obvious reason to understand True Positives is that they directly measure the ability of a classifier to correctly classify positive examples.
Having said that, context is important in classification.
There are some classification tasks where you want to get the maximum number of True Positives.
There are other tasks where you don’t care as much about maximizing TPs, but care more about avoiding False Positives.
I’ll talk more about this a little later in this article, but you need to remember: True Positives are often important in classification, but there’s a tradeoff between detection of True Positives and avoidance of False positives. We need to optimize for the right metric, depending on the task.
Basis for Other Metrics and Evaluation Tools
One of the most important reasons that you need to know what True Positives are is that they form part of the basis of other metrics.
True Positives are involved in the computation of:
- recall (AKA sensitivity)
- precision
- F1-score
- True Positive Rate (which is synonymous with recall)
- ROC Curves
- Confusion Matrices
Listen.
A huge number of metrics and classification evaluation tools use True Positives.
You need to know TPs to understand these other tools and metrics.
Model Optimization
Ultimately, understanding what True Positives are is critical not only for measuring model performance, as noted above, but for optimizing model performance.
When we build a classifier, we almost always need to compute True Positives directly, or we need to compute one of the other metrics or tools listed above.
These not only tell us how the model is performing, but it also guide the choices we make as we build, modify, and optimize the model.
If we want to build a model that is very good at identifying TPs, and the number of True Positives is low (or True Positive Rate, AKA recall, is low), then we probably need to adjust the model.
If you want to become great at building high-performing classification models, then you need to understand True Positives and related concepts at a deep level.
Pitfalls, Caveats and Other Considerations
Although True Positives and related metrics are important for building, evaluating, and optimizing classifiers, there are possible problems associated with fixating exclusively on True Positives, so there are a few caveats and other considerations that we need to discuss.
True Positives often Depend on Classification Threshold
First, the number of True Positives frequently depends on the classification threshold of a model.
Many classification models use what’s called a classification threshold.
This is used for classification models that generate a probability score. Some model types (e.g., logistic regression, decision trees, and neural networks), generate what’s known as a probability score. You can think of this as the model’s confidence that a particular example should get the label positive. It’s a number between 0 and 1, so it’s effectively like a probability.
In these classification models, the classification threshold is used as a cutoff for determining which examples will be labeled as positive and which examples will be labeled as negative.
- If the probability score is greater than the threshold, the model classifies the example as
positive. - If the probability score is less than or equal to the threshold, the model classifies the example as
negative.
So in these types of models, the number of True Positives depends on the classification threshold itself.
Classification Threshold can be Changed
Having just explained how True Positives often depend on classification threshold, it’s very important to point out that in models that have a classification threshold, the threshold can be changed.
In fact, one of the reasons that we use ROC curves is because ROC curves visualize the performance of a classifier for every different threshold. In turn, the ROC curve allows us to identify and select the best threshold for our task or the particular problem we’re trying to solve.
What this means is that since True Positives depend on classification threshold in these cases, and because we can change the threshold, then the number of TPs can vary depending on our choice of threshold.
In classification models that use such a threshold, True Positives are variable depending on our tuning of the model.
True Positives Must Be Viewed Along With False Positives
It’s also important to point out that True Positives must be viewed in the context of other metrics like False Positive.
Remember: the number of True Positives is typically in tension with the number of False Positives. This is particularly the case in models that have a classification threshold as described above.
If we increase a classification threshold, True Positives will decrease, but False Negatives will also increase.
If we decrease a classification threshold, True Positives will increase, but False Positives will also increase.
There’s a tradeoff, and this requires us to look at TPs both in the context of other metrics, but also in the context of what we’re optimizing for (i.e., maximizing True Positives, avoiding False Positives, etc).
Overemphasis Can Be Harmful
This brings us to the sub-point that overemphasis of True Positives can be harmful.
In situations where we want a high number of True Positives, one might be tempted to tune the model to maximize the number of True Positives.
But, doing this while ignoring other metrics might reduce the effectiveness of the model or expose the user of the model to negative consequences associated with excessive False Positives.
True Positives May Be Overrepresented if the Data Are Skewed
In imbalanced datasets – sometimes called skewed dataset – one of the target classes (positive or negative) is overrepresented among the examples.
Having an imbalanced dataset where one class is overrepresented can influence the number of True Positives that a classifier identifies or otherwise cause problems with detection of True Positives.
Here’s how:
Favoring the Majority Class
When we train a classifier on an imbalanced dataset, many types of classifiers will favor the majority class.
The reason for this is because predicting the majority class at a very high rate will yield a high accuracy.
Here’s an example.
Imagine a dataset where 90% percent of the data is negative. If, in the extreme case, the classifier simply predicted all examples as negative, then the model would have a 90% accuracy.
If the minority class is positive, then such a situation would greatly reduce the number of True Positives predicted by the model.
Decreased Sensitivity to the Minority Class
If training data is highly imbalanced, there might be an insufficient number of the minority class for the classifier to learn how to distinguish that class.
For example, let’s say that the training data is highly imbalanced, and the positive class is the minority class (i.e., there are many more negative examples than positive examples).
In such a situation, there may be too few positive examples for the classifier to learn the distinguishing features that are predictive of those positive instances.
In this example, with positive as the minority class, the model’s difficulty with identifying positive instances would likely lead to a fewer number of True Positives.
Note that this problem could be exacerbated by having a very small training dataset.
Overfitting to the Minority Class
When you have an imbalanced dataset, there are some corrective measures that you can take that can cause the model to overfit the minority class.
This could cause an increase in True Positives (if positive is the minority class), but also increase False Positives.
Adjusting Classification Threshold
When you have a skewed dataset, adjusting the classification threshold can improve detection of the minority class. In turn, this can potentially increase the number of TPs.
For example, if you’re working with a model type that outputs probability scores, and positive is the minority class, then lowering the classification threshold would likely yield more True Positive classifications.
Keep in mind though that this would come with the tradeoff of increased False Positives.
Using The Wrong Metrics
In situations where you have an imbalanced dataset, using the wrong evaluation metric can cause problems.
And, perhaps importantly, using raw counts of True Positives can be somewhat misleading.
When you have a skewed dataset, it’s often better to use metrics like precision, recall, F1-score, and area under the Precision-Recall curve. These metrics might provide more insight into how the model is performing with respect to classification of True Positives.
Dealing With Skewed Data
Briefly, a few of the ways that we deal with imbalanced data are:
- oversampling the minority class
- undersampling the majority class
- using synthetic data generation methods like SMOTE
All of these can address a class imbalance, and in turn, they can influence the number of True Positives identified by a model.
Having said that, dealing with imbalanced data can be a tricky issue. So in the interest of brevity, explain more about how to deal with skewed data in a separate blog post in the future.
Wrapping Up
True Positives are a fundamental concept in classification and classification metrics, but they are really just one part of the intricate puzzle.
They provide insight into the model’s ability to correctly classify the positive class, but they must always be viewed along with other classification metrics to get a more comprehensive view of the model’s performance.
Moreover, the number of True Positives must always be viewed in the context of other circumstances, like possible data imbalance, to properly evaluate the model’s ability to properly detect positive instances.
As you study classification, always remember that True Positives are part of a much broader picture when we evaluate classifier performance.
Leave your other questions in the comments below
Do you have other questions about True Positives and how they relate to machine learning classification systems?
Is there something that I’ve missed?
If so, leave your questions in the comments section near the bottom of the page.
For more machine learning tutorials, sign up for our email list
In this tutorial, I’ve explained True Positives and how they relate to classification systems.
But if you want to master machine learning in Python, there’s a lot more to learn.
That said, if you want to master machine learning, then sign up for our email list.
When you sign up, you’ll get free tutorials on:
- Machine learning
- Deep learning
- Scikit learn
- … as well as tutorials about Numpy, Pandas, Seaborn, and more
We publish tutorials for FREE every week, and when you sign up for our email list, they’ll be delivered directly to your inbox.