One of the most common questions I get from data science students is which programming language should I learn for data science, R or Python?
The short answer is “it depends.”
Both R and Python have strengths and weaknesses as data science languages, or as broader programming languages.
So here in this blog post, I want to explain why you should learn R for data science.
I’ll start off by comparing and contrasting R and Python.
… and then I’ll continue the blog post by explaining why R is great for data science, and the types of people I think should learn R for data science.
A Quick Comparison of R and Python as Data Science Languages
Before I explain why I think R is an excellent data science language to learn, let’s first do a quick comparison of R and Python.
R and Python are currently the most common programming languages for data science.
Although both languages are excellent in their own way, each language has strengths and weaknesses.
That being said, I put together a quick-and-dirty table that expresses my personal opinions on the main differences between R and Python. (In the following table, 1 is low/bad and 5 is high/good):
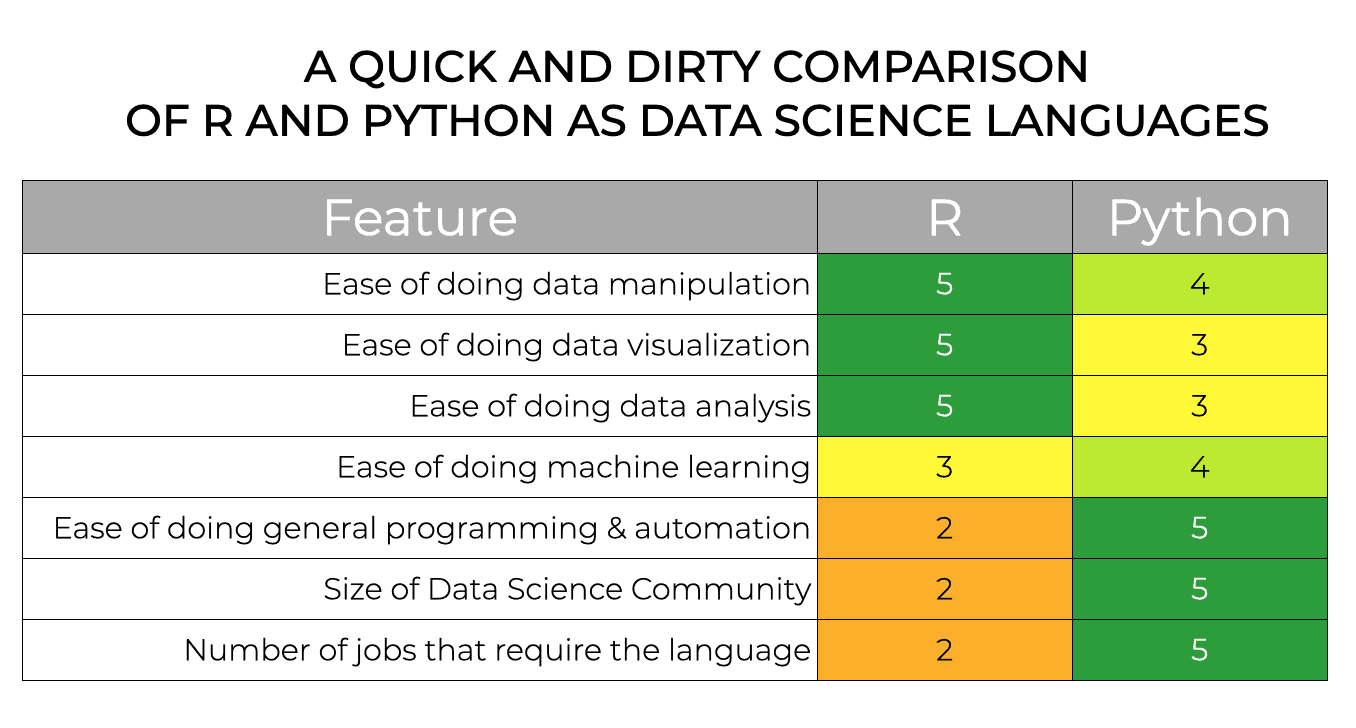
To be clear this is not really scientific. It’s based on my own opinion, and many years of experience as a data professional and as someone who teaches data science. And that being the case, there’s probably some room for argument about the exact numbers.
But at a glance, it should help you understand the strengths and weaknesses of both languages.
R and Python are Good at Different Things
If you look at the table, you’ll see that R and Python are both good, but they are really excellent in different areas.
Python, in my opinion, is OK at data manipulation (i.e., Pandas) and data visualization (i.e., matplorlib and Seaborn). Python’s Scikit Learn is generally stronger than R for machine learning. And Python – in my opinion – is much better for general programming, software development, and automation. Essentially, if I need to build a system, Python is much better than R.
But even with all of it’s strengths, I still have not moved entirely to Python.
There are still many instances where I prefer to use R, and they really center around three things.
The 3 Reasons That R is Great For Data Science
In the above table, you’ll notice that R scores a ‘5’ in three areas:
- data manipulation
- data visualization
- data analysis
These areas are where R really shines in comparison to Python.
And these 3 strengths translate into 3 reasons why I think R is a great data science language:
- dplyr is better than Pandas for data manipulation
- ggplot2 is better than Seaborn or Matplotlib for data visualization
- data analysis with dplyr + ggplot2 is simple and powerful
These should inform your decision about which language to chose (R or Python).
Later in the blog post, I’ll discuss the types of people I think should learn R instead of Python.
But first, let’s look at each of the 3 reasons I like R in a little more detail.
dplyr is Better than Pandas
In my opinion, dplyr is slightly better than Pandas for data manipulation.
Why?
The biggest reason is ease of use.
Both dplyr and Pandas are relatively easy to use. You’ll notice that I gave dplyr a ‘5’ and Pandas a ‘4’ for “ease of use” in the above table.
Both are fairly easy to use, but I give the edge to R’s dplyr.
Concerning syntax, all of the major functions in dplyr are simple and well named. For example, you ‘filter’ rows using the filter() function. You ‘select’ columns using the select() function. And you ‘rename’ columns with the rename() function. In dplyr, the function names are simple and they closely describe what they actually do. Reading and writing dplyr code is almost like using English.
Moreover, you can use a special technique in dplyr that I sometimes call “dplyr chaining” to combine dplyr functions together.
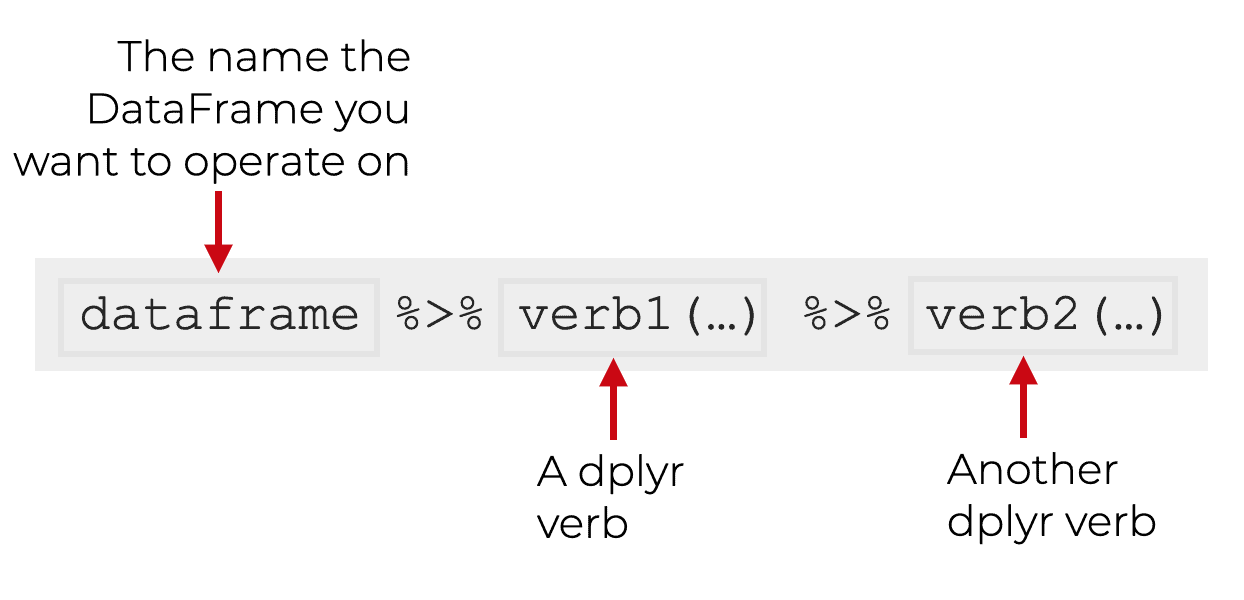
This enables you to create data manipulation pipelines that accomplish complex data manipulations in a simple, linear, step-by-step way. If you’ve struggled with data manipulation in the past, you need to know this technique. It makes data manipulation so much easier.
Although Pandas is also similar, in the sense that all of the functions are well named, the functions are slightly more difficult to remember and the syntax is a little more complex. Not much, but a little. (But to be clear, many people still use “bracket notation” to add variables and manipulate dataframes in Python. This is a terrible practice, because it’s hard to read and hard to use.)
The truth is, if I had to choose, I’d probably choose dplyr over Pandas. I really love using dplyr for data manipulation.
ggplot2 is Better than Seaborn or Matplotlib
Where R really shines in comparison to Python is in data visualization.
Today, the primary data visualization tool for R is ggplot2.
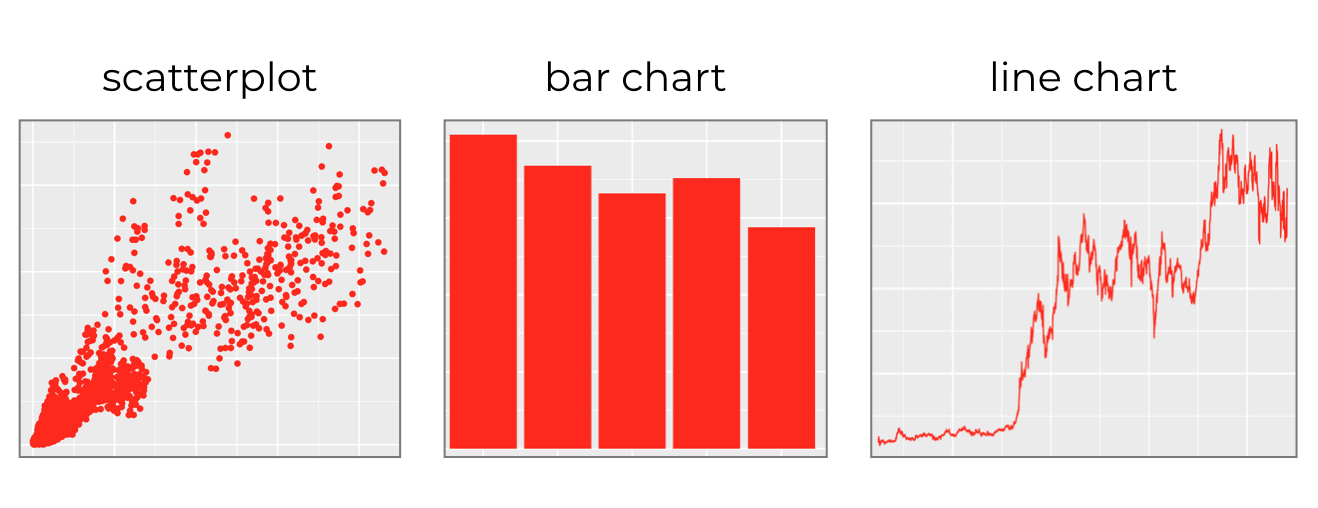
ggplot2 is simple, easy to use, and extremely powerful.
You can use ggplot2 to make simple data visualizations like scatter plots, bar charts, or line charts:
But you can also use ggplot2 to create intricate, beautiful data visualizations like this choropleth map:
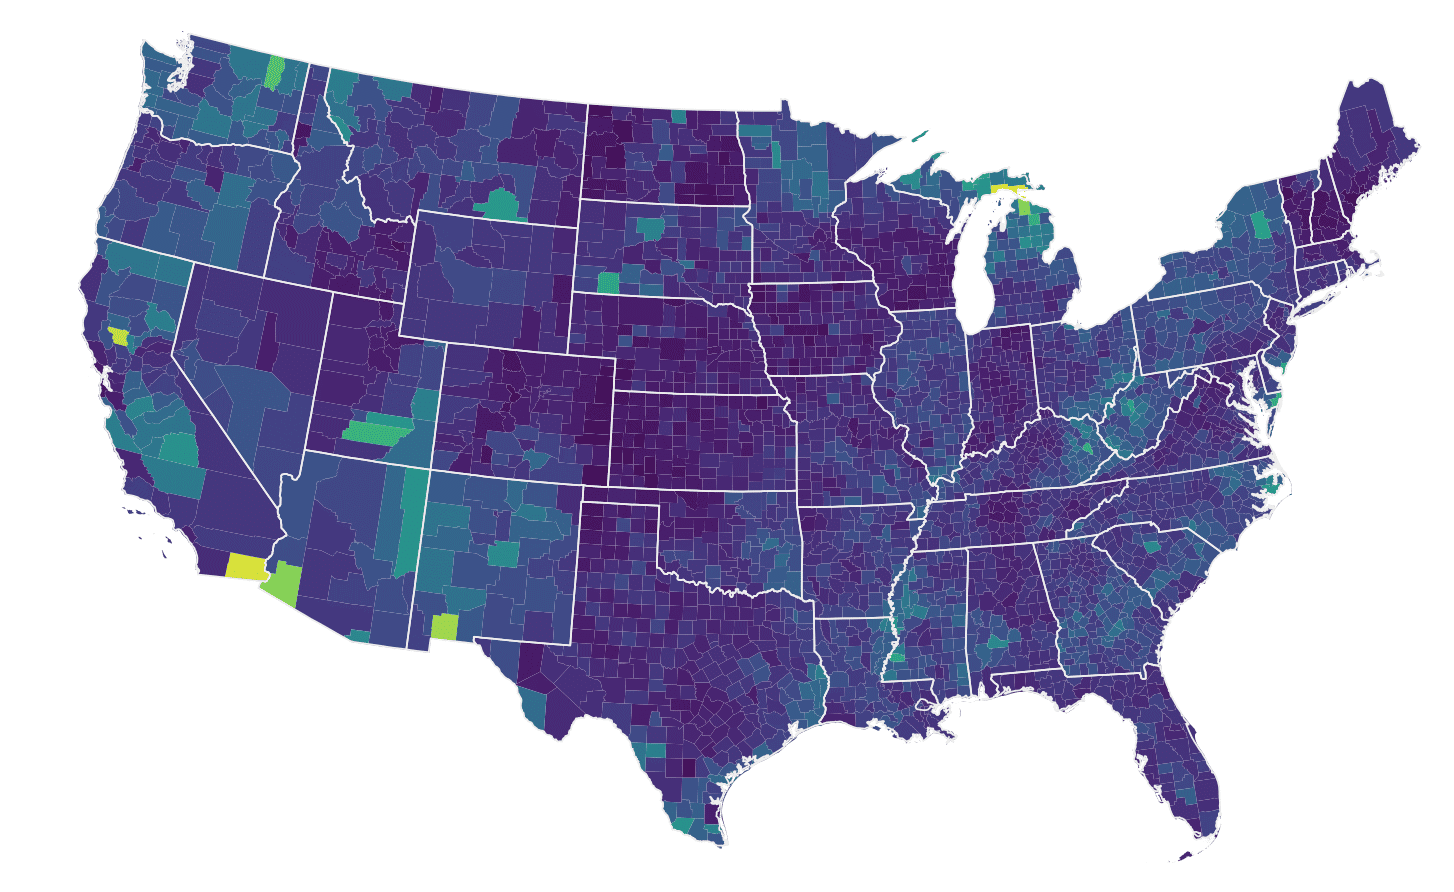
So you can use ggplot to create simple data visualizations, but you can also use it to create very complex visualizations. It’s very flexible and very powerful.
Now to be fair, ggplot2 has a bit of a learning curve. Some beginners are confused when the first look at the syntax.
But the syntax for ggplot is extremely systematic. Once you understand how the ggplot system works, everything makes so much damn sense.
(For a quick introduction to ggplot2, check out our ggplot2 tutorial for beginners.)
Data Analysis with dplyr + ggplot2 is Simple and Powerful
Perhaps the killer feature of R as a data science language is the combination of dplyr plus ggplot2.
As I mentioned previously in the section on dplyr, you can use a special operator called the “pipe operator” to combine together different dplyr functions. That enables you to perform complex data manipulations by combining simple dplyr functions. It’s like combining little building blocks together.
But you can also combine dplyr functions with ggplot2 functions in pipelines.
For example, in a previous blog post, the R data analysis of covid-19 data, we combined together several dplyr functions along with ggplot2 to create a small multiple chart. Specifically, we combined dplyr’s filter, group_by, and summarise with ggplot2’s geom_line and facet_wrap.
covid_data %>%
filter(country %in% covid_top_12$country) %>%
group_by(country, date) %>%
summarise(new_cases = sum(new_cases)) %>%
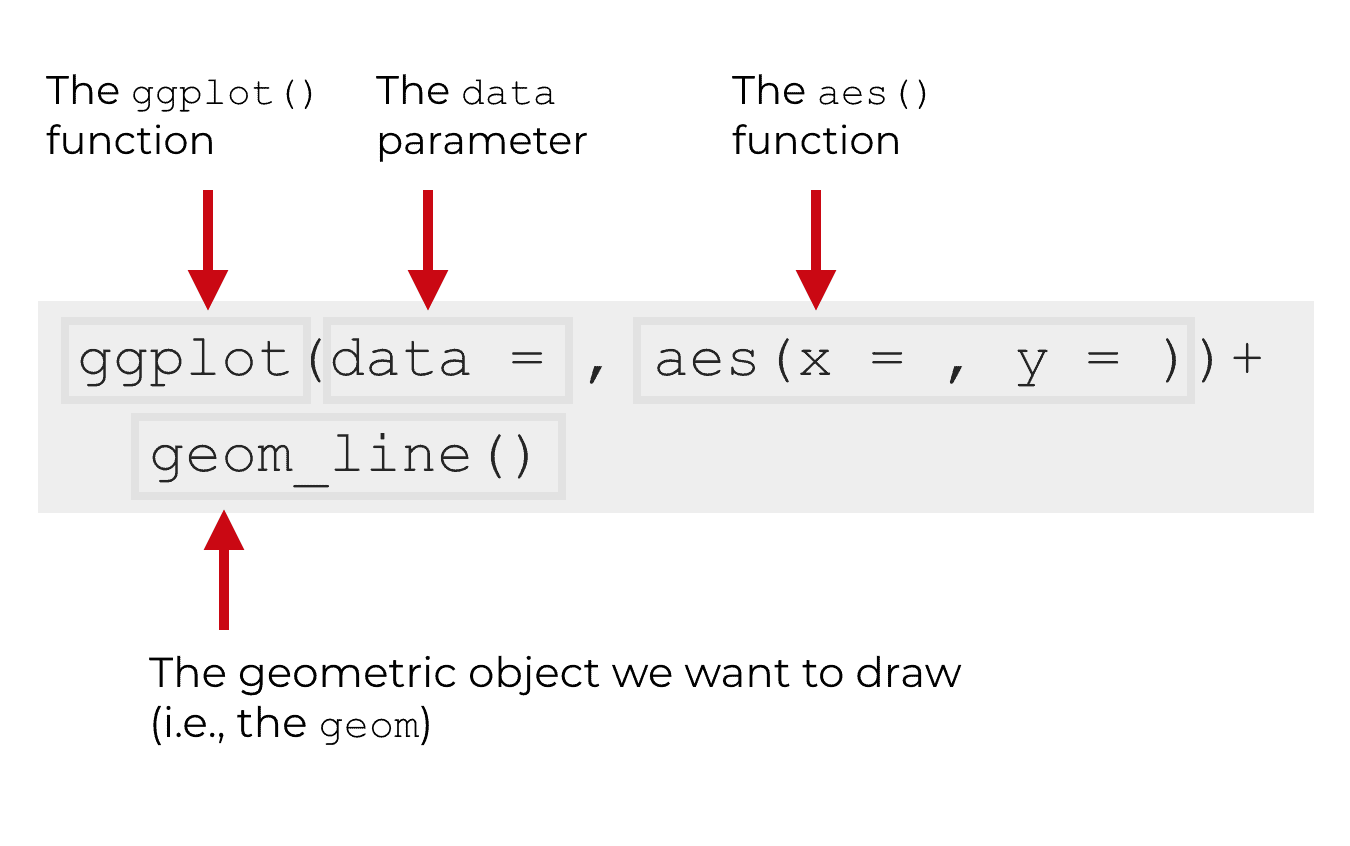
ggplot(aes(x = date, y = new_cases)) +
geom_line() +
facet_wrap(~country, ncol = 4)
OUT:
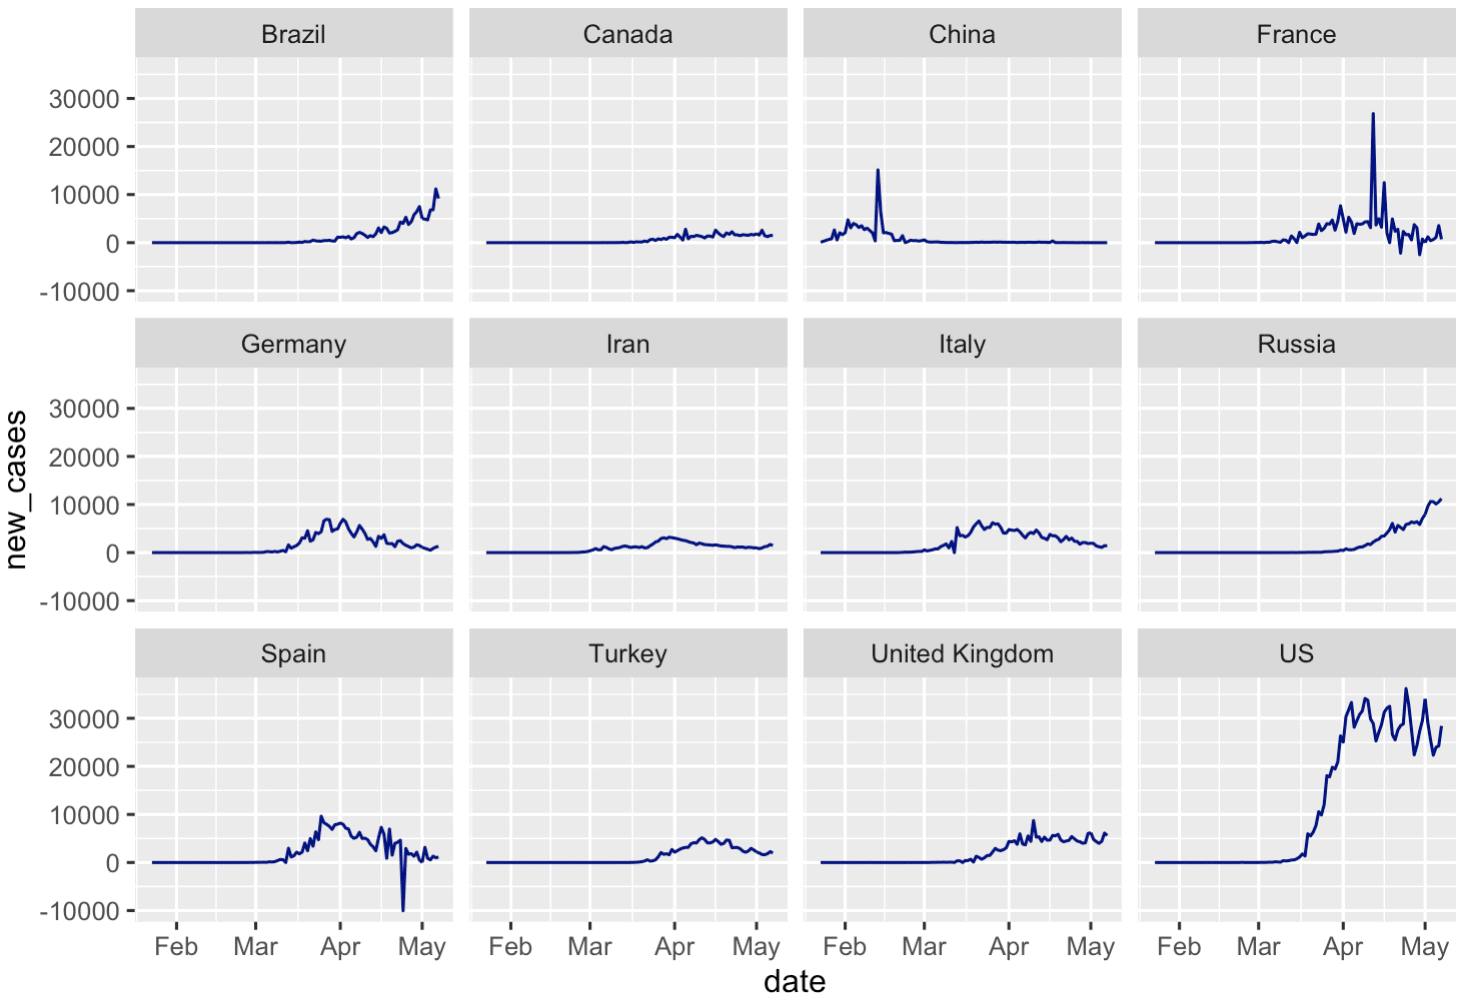
Not to be fair, we needed to do quite a bit of data wrangling to create our dataset in that analysis, the covid_data dataset.
But once we had that data, we were able to use dplyr + ggplot2 to quickly analyze our data. We did that by filtering, aggregating, and summarizing the data with dplyr, and then sending that output to ggplot to visualize it.
This combination of ggplot2 + dplyr is extremely powerful for data analysis.
If you’re struggling with data analysis, dplyr + ggplot2 is arguably the best toolkit, once you learn how to use them correctly.
So if your job primarily involves gathering, wrangling, visualizing, and analyzing data with more than a few thousand rows and you want sophisticated, modern tools, R is arguably the best choice.
R is the Best Data Analytics Language
One final point.
Because R is excellent at data manipulation, data visualization, and data analysis, I think that R is the best language for “data analytics”.
What’s the difference between data analytics and data science?
A quick-and-dirty look at data analysis vs data analytics vs data science
There’s not a clear definition here, but this is how I think of it:
If you’re doing low-scale data wrangling and analysis with a small number of rows, and you’re using old-school tools (like Excel), then that’s data analysis.
If you’re doing larger-scale data wrangling, visualization, and analysis with moderate scale, but you’re not doing really advanced work like machine learning or AI, that’s data analytics.
… Data analytics is like data analysis on steroids. Or, data analytics is like data analysis, with modern “power tools” like R. Data analytics is like a subset of data science.
Finally, if you’re doing larger-scale data wrangling, visualization, and analysis … AND you’re doing machine learning and AI, then that’s data science.
Again, there aren’t clear definitions here, but the way I think of it, “data analytics” is a type of very-sophisticated, larger-scale data analysis, with modern power tools.
R is My Favorite Language for Data Analytics
In my opinion, R is the best programming language for data analytics.
Any time I need to wrangle, visualize, and analyze my data, but I don’t need to do machine learning or software engineering, I strongly prefer to do it in R. This is especially true if I have more than a few thousand rows of data (if there’s less than this, I might do it in Excel). And it’s also especially true if I need more sophisticated tools than what Excel offers.
Types of People Who Should Learn R For Data Science
Ultimately, although Python has its strengths, I think that R is better for data manipulation, data visualization, and data analysis.
So I think that R is the best choice for a few groups of people:
- data analysts who want to improve their skills
- people who want to focus on data visualization
- data science beginners who want to be productive fast
If you fall into one of these categories, and you’re trying to decide which language to learn, you might want to learn R.
Once you know the right packages (like ggplot2, dplyr, and the rest of the Tidyverse) you’ll have a powerful, easy to use toolkit for doing data manipulation, data visualization, and data analysis.
Leave Your Questions in the Comments Below
Do you have questions about this?
Are you still uncertain about which language to choose? R or Python?
Leave your questions in the comments section below.
Join Our Premium R Data Science Course
If you’re serious about learning dplyr, ggplot2, and data science in R, you should consider joining our premium course called Starting Data Science with R.
Starting Data Science will teach you all of the essentials you need to do data science in R, including:
- How to manipulate your data with dplyr
- How to visualize your data with ggplot2
- Tidyverse helper tools, like tidyr and forcats
- How to analyze your data with ggplot2 + dplyr
- and more …
Moreover, it will help you completely master the syntax within a few weeks. We’ll show you a practice system that will enable you to memorize all of the R syntax you learn. If you have trouble remembering R syntax, this is the course you’ve been looking for.
Find out more here:
Thank you for sharing this information who has a career stating data science is very helpful for better understanding.