This blog post explains precision in classifiers and machine learning models.
It will explain what precision is, the pros and cons of this metric, how to improve precision, and more.
Table of Contents:
- A Quick Review of Classification
- Precision Basics
- Pros and Cons of Precision
- How to Improve Precision
- Alternatives to Precision
If there’s something specific that you need, you can click on any of the above links.
Having said that, this concept will probably make more sense if you read the whole blog post.
Ok, let’s get to it.
A Quick Review of Classification
I know that you’re itching to get to the oh-so-sexy topic of “precision,” but in order to really understand precision, you need to know a few things about classification.
I promise that this is worth it.
If you need some help understanding precision, then you probably need a quick review of the underlying mechanics of classifiers.
Once we quickly review this, you’ll have a better foundation for understanding precision.
Machine Learning Overview
First, let’s talk about what machine learning is generally.
In machine learning, we build computer systems that improve on a task as we expose them to data.
These computer systems learn without explicit instructions about how to operate.
What is Classification
Now, under the umbrella of “machine learning,” there are different types of machine learning systems.
One type of machine learning system are classification systems.
Classification systems (AKA, classifiers), learn how to – wait for it – CLASSIFY examples.
So when we train classifiers, we feed in data that has categorical target vales that we call “labels.”
Once the classifier is trained, we can use the classifier to predict the correct label for new incoming data examples.
To better understand what classifiers are, let’s take a look at an example.
(We’ll get to precision soon after that, I promise.)
A quick example of classification
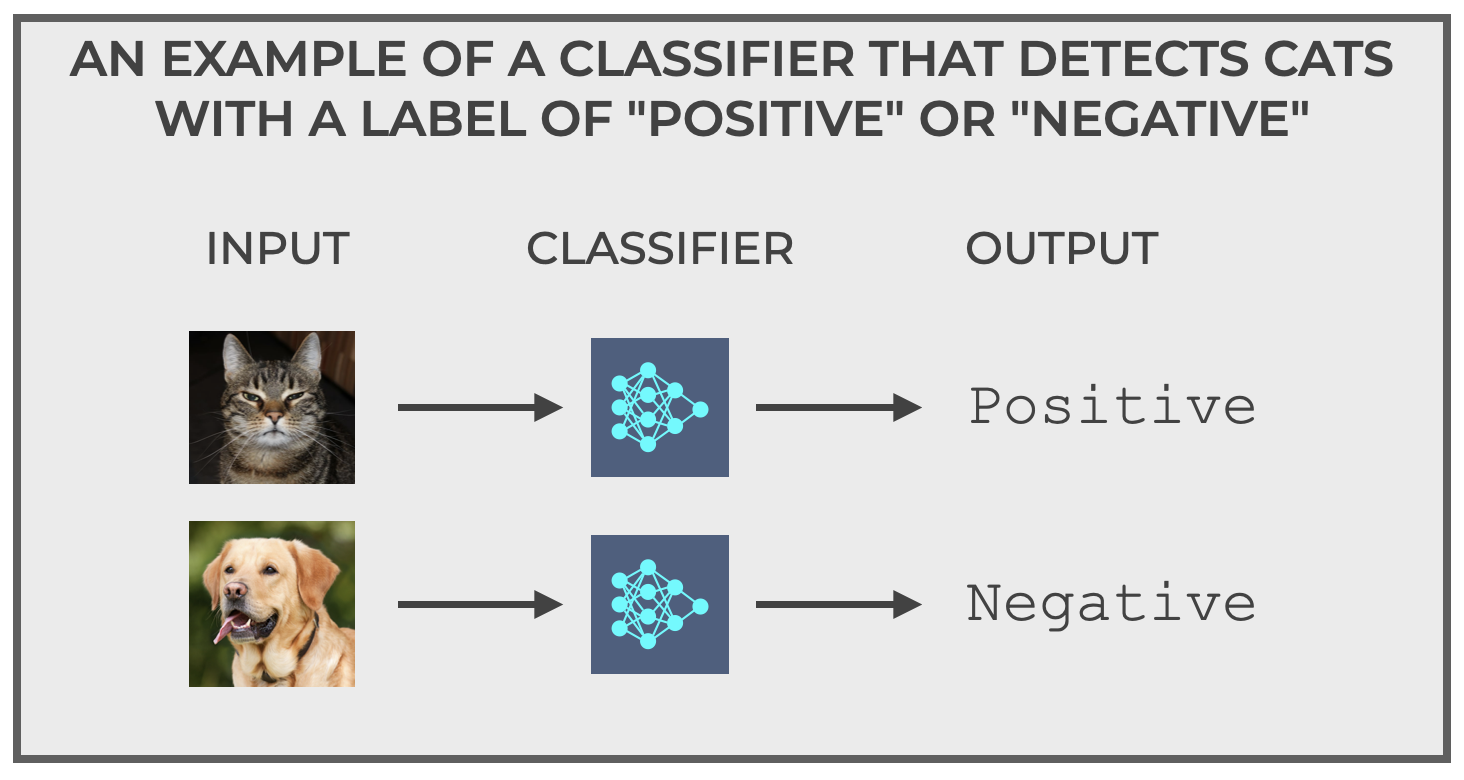
My canonical example of a classifier is one that I call “The Cat Detector.”
The Cat Detector is simple.
The input to the Cat Detector is a set of pictures.
The output of the Cat Detector is one of two labels:
Positiveif the image is a cat.Negativeif the image is not a cat.
It’s a binary classifier. Input a picture and output either positive or negative.
Pretty simple right?
Well, yeah, but … it’s a bit more complicated.
Classification Mistakes
The issue here is that classification systems are imperfect.
Classifiers make mistakes.
Almost all classifiers make mistakes (unless the problem is trivially easy).
To illustrate, let’s go back to our Cat Detector.
Ideally, you feed it an image of a cat, and it outputs positive, meaning that the input image is a cat.
And if you feed it something that’s not a cat (such as an image of a dog), the Cat Detector should output negative, indicating that the input image is not a cat.
But it’s possible for our classifier to incorrectly output the wrong class.
So for example, the Cat Detector could input the image of an actual cat but incorrectly output negative.
Conversely, it could input the image of a non-cat but incorrectly output positive.
So in this image below, you see the correct types of predictions with the green check marks, but the incorrect types of predictions with the red Xs.
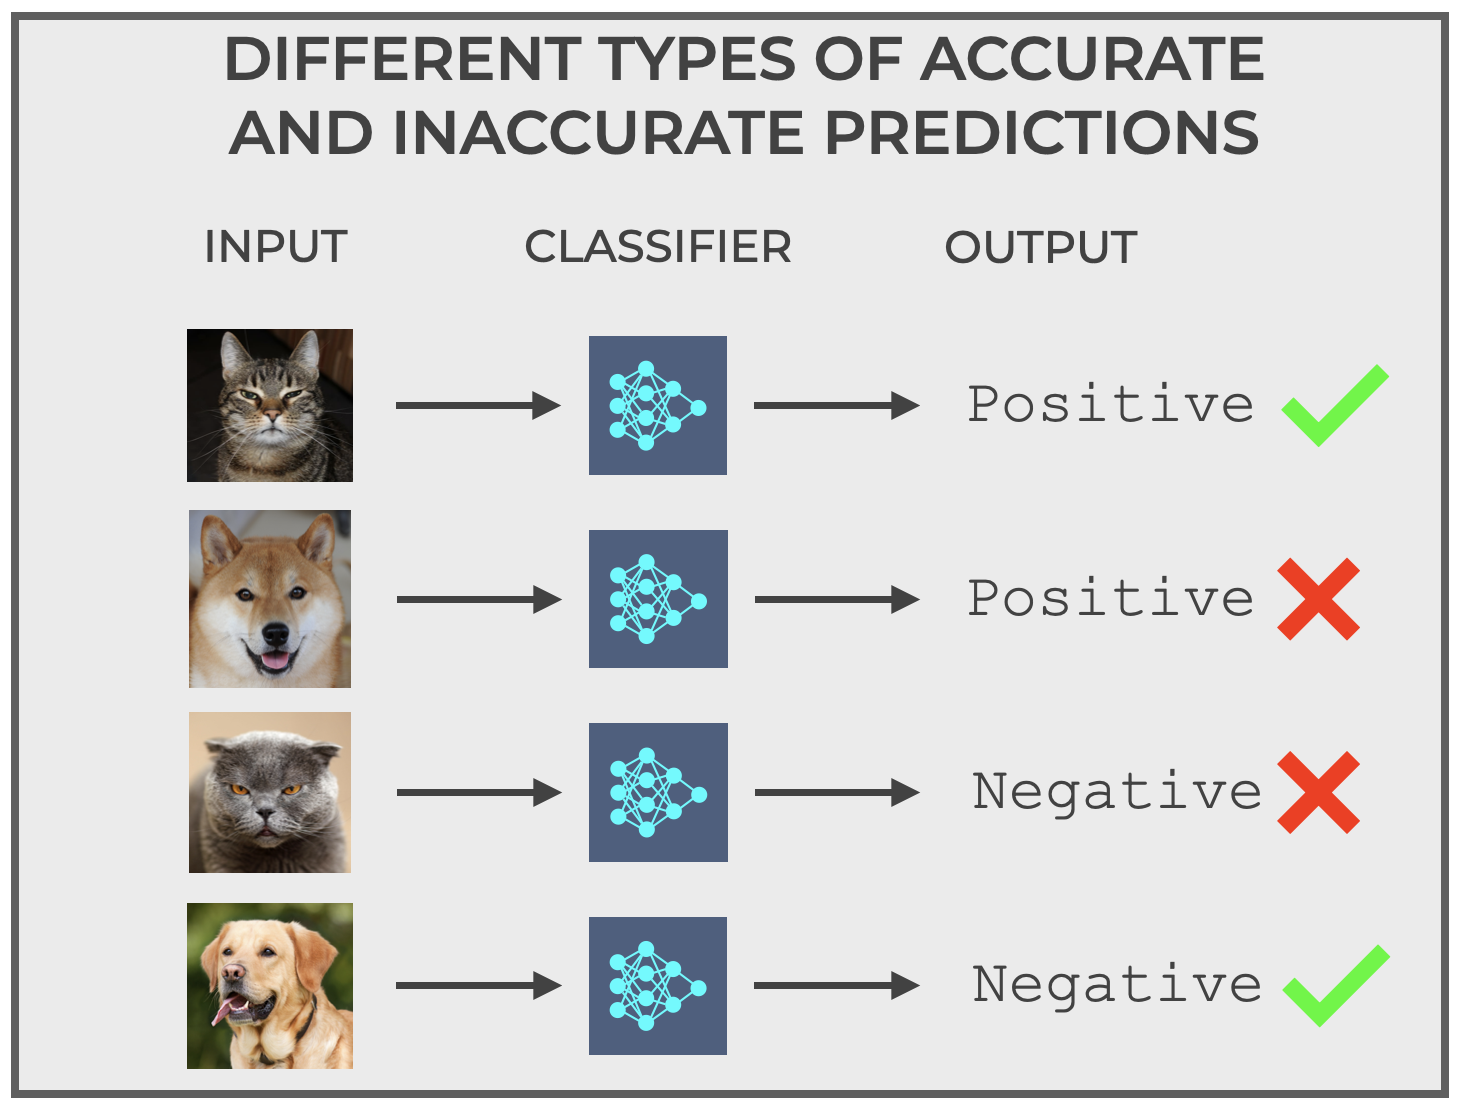
The types of correct and incorrect predictions are at the heart of classifier evaluation.
And for the purposes of our blog post here, they are also at the heart of classifier precision.
To get a little more clarity around these prediction types, let’s discuss these correct and incorrect predictions.
Correct and Incorrect Prediction Types
As mentioned above, there are four prediction types for a binary classifier.
For the Cat Detector in our example above, they are as follows:
- Correctly predict
positivewhen it’s actually a cat - Correctly predict
negativewhen it’s actually not a cat - Incorrectly predict
positivewhen it’s actually not a cat - Incorrectly predict
negativewhen it’s actually a cat
If we generalize this for all binary classifiers (with positive and negative classes), then these prediction types can be described as follows, and with specific names:
- True Positive: Predict
positivewhen the actual value is positive - True Negative: Predict
negativewhen the actual value is negative - False Positive: Predict
positivewhen the actual value is negative - False Negative: Predict
negativewhen the actual value is positive
Once again, this might seem a bit dull, but it’s critical to understand True Positive, True Negative, False Positive, and False Negative.
Why?
Because we use them when we compute almost all of our classification evaluation metrics.
And specifically, we use them to compute precision.
Precision Basics
So now that we have a foundation in how classifiers work, and the types of correct/incorrect predictions that classifiers make, we’re well equipped to discuss precision.
Put simply, precision is the number of True Positive predictions, divided by the total number of examples that were predicted as positive.
(1) 
Said differently, precision is the number of True Positive predictions divided by True Positives plus False Positives.
(2) 
If we visualize a simple classification model with positive and negative predictions as follows, then you can also visualize precision:
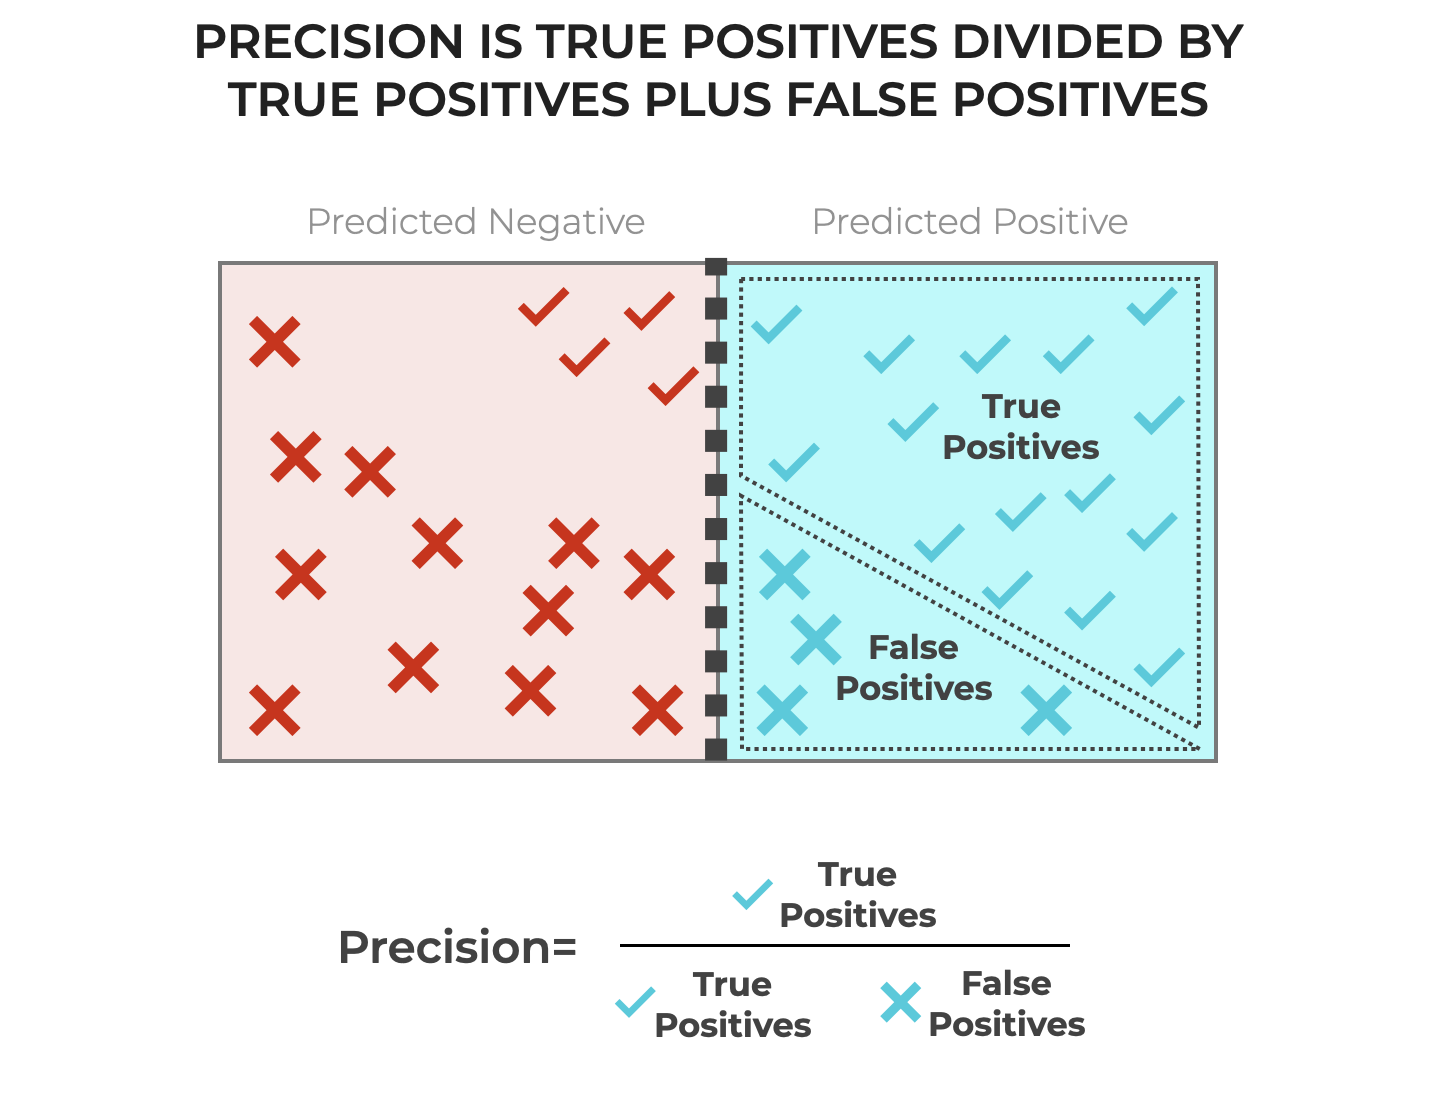
(Hopefully now you understand why we needed to go into all of those details about True Positives, False Positives, etc.)
Essentially, precision tells us the proportion of all of the positive predictions that were actually positive.
An Example of Classification Precision
To illustrate how we use precision and how to calculate it, let’s work through an example.
We’ll assume that we’re using the Cat Detector system that I described above.
We have 100 input pictures (AKA, “examples”) that we feed into the model. There are 50 pictures of cats and 50 pictures of dogs.
Given these inputs, the Cat Detector outputs the following classifications:
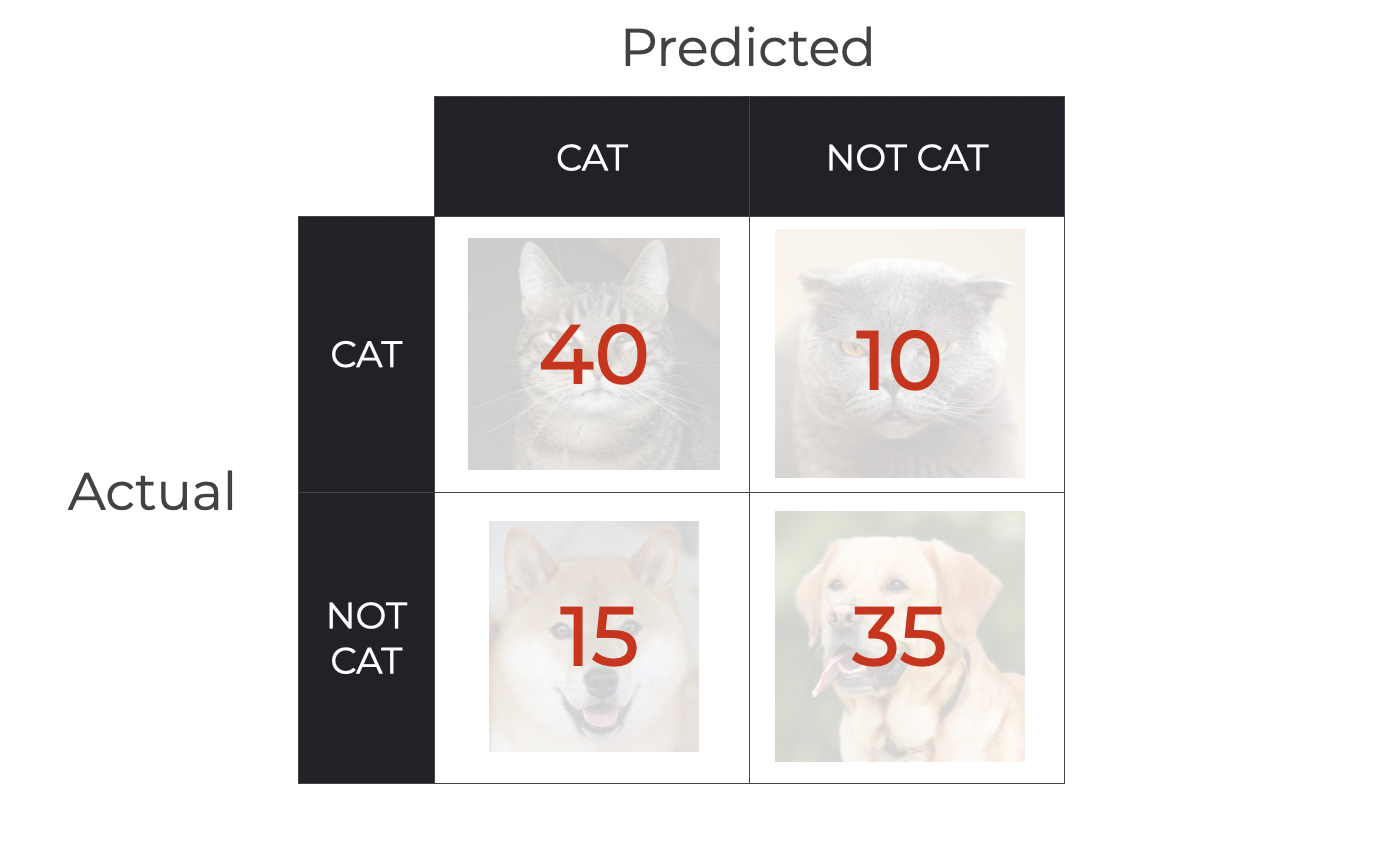
So, we have the following predictions:
- 40 True Positives (pictures of cats predicted as cat)
- 35 True Negatives (pictures of non-cats predicted as not cat)
- 15 False Positives (pictures of non-cats predicted as cats)
- 10 False Negatives (pictures of cats predicted as not cat)
Using these numbers – and in particular, the numbers for True Positives and False Positives – we can calculate the precision.
Calculating precision with TP, TN, FP, and FN
So given the above numbers, let’s calculate the classifier’s precision.
Remember that precision is the number of True Positives divided by the number of True Positives plus False Positives.
Therefore, using the numbers for TPs and FPs seen above, we can calculate precision as follows:
(3) 
So, for this particular example, the precision of the classifier is .727.
The Pros and Cons of Classification Precision
As you’ve just seen, precision is simple to calculate, and it’s also a very common metric that we use to evaluate machine learning classifiers.
Having said that, like all machine learning metrics, precision has strengths and weaknesses as an evaluation tool, so you need to understand the advantages as well as the limitations.
So, let’s quickly review the pros and cons of precision:
The Pros of Precision
Here are the main pros of using accuracy to evaluate classifiers:
- Useful When You Need to Avoid False Positives
- Focus on Positive Class
- Useful for Imbalanced Datasets
- Combines Well with Recall
Let’s look at each of these.
Useful When You Need to Avoid False Positives
Precision is a particularly important metric in situations when you want to avoid false positives, or when the cost of false positives is very high.
For example, there are some medical diagnostic situations where a diagnosis could trigger costly treatments or interventions. Of course, this needs to be weighed against the severity of the potential disease.
Focus on Positive Class
Precision provides a measure of how well the model predicts the positive class.
In situations where the positive predictions are more important than the negative predictions, you will often want to evaluate your model with precision.
Useful for Imbalanced Datasets
In a dataset that has many more negative examples than positive examples, precision is typically a more useful metric than accuracy.
In such a situation, precision will show how accurate the model makes predictions for the minority class.
Combines Well with Recall
We commonly use precision in combination with recall.
Precision measures the accuracy of the positive predictions, and recall measures the ability of the model to correctly identity all of the actual positive examples.
Precision makes sure that the model’s positive predictions are reliable, and recall ensures that the model correctly identifies all of the actual positive examples.
When used together, they provide a more balanced view of the model’s performance, particularly in situations where both False Positives and False Negatives could have significant costs or downsides.
The Cons of Precision
Although precision is useful in certain situations, precision also has some weaknesses as a classification metric.
Here are the major downsides of precision:
- Neglect of True Negatives
- Bad as a Standalone Metric
- Trade-off with Recall
- Harder to Use if Positive Class is Rare
- Poorly Reflects Overall Accuracy
Neglect of True Negatives
Take a look again at the equation for precision:
(4)
Precision focuses solely on the positive predictions (both TP and FP). At the same time, it totally ignores the True Negatives.
Said differently, precision fails to provide direct insight into how a classifier predicts the negative examples.
In situations where it’s also important to correctly classify the negative examples, precision can be a bad metric.
Bad as a Standalone Metric
It can be misleading to rely only on precision, because in some situations, it can be easy to achieve a high precision.
For example, you could build a model that only makes a prediction of positive when it’s very certain, trying to constrain the False Positives as much as possible.
But doing this often requires making many fewer positive predictions overall, which can increase the False Negatives.
So by being more conservative with the positive predictions, you can increase the proportion of positive predictions that are correct. But at the same time, you might incorrectly classify more positive examples as negative, thereby decreasing recall.
This is the reason that precision is often paired with recall. It shows you the tradeoff between achieving higher precision vs the cost for a lower recall (and visa versa).
Trade-off with Recall
As I just mentioned, there is often a tradeoff between precision and recall.
When you improve precision, you’ll typically decrease recall (and visa versa).
So, over-optimizing for precision may damage the recall of the model.
Harder to Use if Positive Class is Rare
If the positive class is rare in the dataset, it may be difficult to use precision alone.
That’s because there will be fewer positive examples, and therefore relatively fewer possible True Positives.
And there will also be relatively more negative examples in the data. If a relatively large proportion of these negative examples are incorrectly classified as positive, there will be a larger number of False Positives, which will reduce precision. (So more negative examples increase the risk of False Positives.)
Therefore, if the positive class is rare, you may need to be much more careful with using precision alone, and may need a more nuanced view of the performance by examining precision along with recall, or by using a metric like F1 score, which harmonizes both precision and recall.
Poorly Reflects Overall Accuracy
Precision provides limited insight into the total number of correct predictions.
That is, precision only measures the ability of the model to correctly classify the positive examples, but it ignores how well (or poorly) the model classifies the negative examples.
Precision only looks at the model’s performance on the positive examples.
If you want a more complete view of the model’s performance, then you may want to use accuracy, which explicitly accounts for the model’s performance on the negative examples (although accuracy also has limitations when used on imbalanced data). You might also want to look at precision along with recall and F1 score for a more wholistic view.
How to Improve Precision
Now that I’ve explained what precision is and the pros and cons of precision, let’s quickly discuss how to improve precision in classification systems.
At a high level, there are a variety of strategies you can use to improve precision:
- Data Preprocessing
- Feature Selection and Engineering
- Choosing a Good ML Algorithm
- Hyperparameter Tuning & Cross Validation
- Threshold Tuning
- Domain-Specific Techniques
- Error Analysis
- Cost-Sensitive Learning
Let’s discuss each of these, one at a time.
Data Preprocessing
Data cleaning and preprocessing can improve accuracy.
Preprocessing includes:
- Data Cleaning: This involves removing duplicate examples, dealing with missing values, and fixing errors in the data that might decrease accuracy.
- Normalization and Standardization: Normalization and standardization rescale numeric data in order to prevent certain features dominating the model over others due to scale differences. Normalization rescales the values of features to have a range of [0, 1]. Standardization rescales data to have a mean of 0 and a standard deviation of 1.
- Encoding Categorical Variables: Variable encoding is a type of recoding that converts categorical variables into numbers, with methods like one-hot encoding.
- Handling Imbalanced Data: As I mentioned previously in this blog post, imbalanced data can cause problems with precision. We can correct data imbalances by using techniques like undersampling the majority class and oversampling the minority class.
Feature Selection and Engineering
Feature selection and feature engineering can both improve classifier precision:
- Feature Selection: Feature selection identifies the most important features and removes unimportant features. Removing the unimportant features reduces redundancy and decreases overfitting.
- Feature Engineering: In feature engineering, transform existing features or create new features to better capture the important patterns in the data that help identify the positive class.
Choose a Good ML Algorithm
The precision of a classifier is often strongly influenced by the choice of classification algorithm.
Different classification algorithms – such as logistic regression, support vector machines, decision trees, neural networks, etc – have different strengths and weaknesses.
Some algorithms will achieve better precision in certain circumstances.
You need to understand the strengths and weaknesses of different algorithms to ensure that you select the most appropriate algorithm for your task.
It’s also worth noting that ensemble methods (like bagging or boosting) can sometimes improve precision, since they combine predictions of multiple models in order to make a final classification decision.
Hyperparameter Tuning
You can “tune” the hyperparameters of a classifier in order to improve precision.
Hyperparameters – like the depth of a decision tree – often have a big impact on model performance metrics like precision.
You can use tools like random search and grid search to search the parameter space to find the best settings for hyperparameters.
Cross Validation
Cross validation can also improve precision.
In cross validation, you repeatedly split your dataset into training data and validation data. Then, you train the model. You perform this process of repeatedly dividing and training multiple times. Effectively, this helps you better see how the model will perform when exposed to previously unseen data.
Threshold Tuning
By default, many classification models use .5 as the classification threshold for binary classification. But, this threshold can typically be adjusted.
Increasing classification threshold typically makes the model more conservative in predicting the positive class. In turn, this can potentially increase precision.
Domain-Specific Techniques
Depending on the specific task and problem space, some machine learning techniques might be more effective than others.
For example, in text classification, using NLP techniques such as TF-IDF for feature extraction can improve precision.
Error Analysis
You can perform error analysis to understand why false positives are happening.
For example, there might be patters in the mistakes, or specific types of examples that the model consistently misclassifies.
Addressing these issues can improve precision.
Cost-Sensitive Learning
In cost-sensitive learning, you can assign a higher cost for certain types of mistakes.
To improve precision, you can impose a higher cost for False Positives (compared to False Negatives). This could cause a classifier more cautious in how it classifies positive examples, thus improving precision.
Implement cost-sensitive learning where false positives are given a higher cost compared to false negatives. This can make the model more cautious about predicting positives, thus improving precision.
Overall, improving precision often requires a combination of techniques, including good data cleaning, model choice, tuning, and other strategies.
All of these need to be used in the context of the specific problem at hand, with repeated model evaluation to ensure that the changes are indeed leading to better model precision.
Alternatives to Precision
As mentioned briefly above, precision is one of many metrics that you can use to evaluate the performance of a classification system.
And, some metrics work better for certain situations and tasks.
That said, you need to know the full range of evaluation tools and metrics, like accuracy, recall, F1-score, confusion matrices, and others.
Because all of these are somewhat complex, I’ll write each of them in separate blog posts.
Wrapping Up …
Precision is an important metric for evaluating machine learning classifiers. It’s also one of the most common, so you need to understand it well.
That said, precision has strengths and weaknesses. You need to learn the limitations of precision, as well as the cases when it’s appropriate to use it, how to improve it, etc.
Hopefully, this tutorial gave you a solid overview of precision and hopefully it will serve as a good foundation for your learning about machine learning evaluation.
Leave Your Questions and Comments Below
Do you have other questions about precision?
Are you still confused about something, or want to learn something else about precision that I didn’t cover?
I want to hear from you.
Leave your questions and comments in the comments section at the bottom of the page.
Sign up for our email list
If you want to learn more about machine learning, then sign up for our email list.
Several times per month, we publish free long-form tutorials about a variety of data science topics, including:
- Scikit Learn
- Pandas
- Numpy
- Machine Learning
- Deep Learning
- … and more
If you sign up for our email list, then we’ll deliver those free tutorials to you, direct to your inbox.
That was well explained.
Thank you.
You’re welcome.